Figures & data
Table 1. Details of microarray data.
Figure 1. Identification and Functional Enrichment Analysis of Differentially Expressed CRGs in AKI. (A) Heatmap: Illustrating expression patterns of the six differentially expressed CRGs. (B) Circos Plot: Indicating the relationship between genes and Gene Ontology (GO) terms. (C) GO Categories: Representing Molecular Function (MF), Biological Processes (BP), and Cellular Components (CC) associated with CRGs. (D) KEGG Analysis: Unveiling the pathways enriched in the differentially expressed CRGs in AKI. (E) Correlation Analysis: Investigating the interplay among the six differentially expressed CRGs.
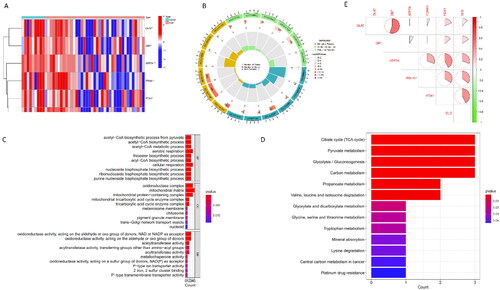
Figure 2. Immune infiltration and correlation analysis with CRGs. (A) Fractional representation of 22 immune cell types in both AKI and non-AKI control samples. (B) Boxplot illustrating the differences in immune infiltration cells between AKI and non-AKI controls. Statistical significance denoted by *p < 0.05 and **p < 0.01. (C) Correlation analysis depicting the relationship between CRGs and immune infiltration cells.
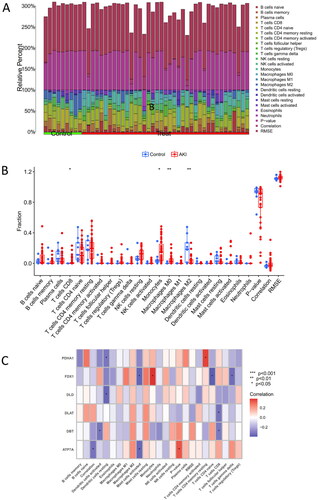
Figure 3. Construction and validation of the cuproptosis gene predictive diagnostic model.
(A) Nomogram illustrating the diagnostic potential of CRGs. (B) Calibration curve demonstrating the predictive accuracy of the non-correlation nomogram in the cohort. (C) ROC curve evaluating the diagnostic efficacy of the predictive diagnostic model. (D) ROC curve analysis assessing the diagnostic performance of the model in the test set of GSE30718.
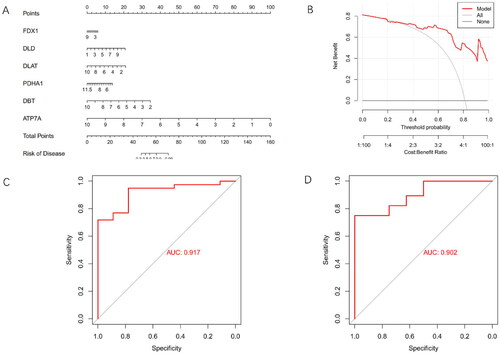
Figure 4. Identification of Cuproptosis-Related Subclusters in AKI.
(A)Consensus clustering matrix illustrating the stability of subclusters when k = 2.
(B)Representative Cumulative Distribution Function (CDF) curves providing insights into the clustering stability.
(C) Heatmap of the non-negative matrix showcasing the distinct patterns within the identified subclusters.
(D) Principal Component Analysis (PCA) plot visually representing the separation between the cuproptosis-related subclusters in Alzheimer’s Disease.
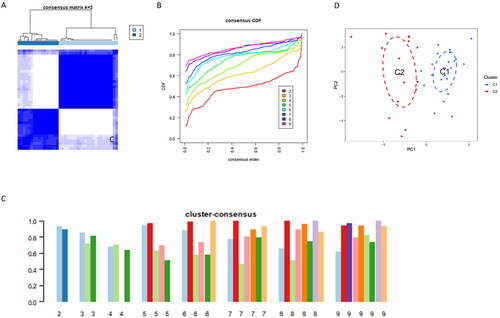
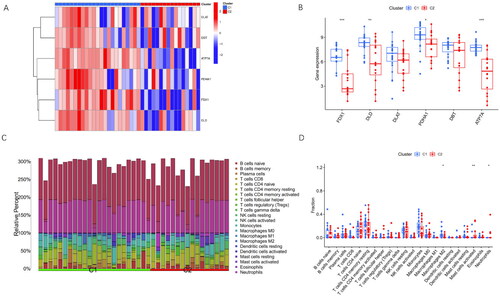
Figure 5. Differentiation Analysis and Immune Infiltration Analysis of Two Cuproptosis Subclusters.
(A) The heatmap illustrates clinical features and expression patterns of six CRGs in the identified cuproptosis subclusters.
(B) Boxplots depict the expression levels of the six CRGs between the two cuproptosis subclusters, with statistical significance denoted by *p < 0.05 and **p < 0.01.
(C) Relative abundances of 22 immune cells are presented for the two cuproptosis-specific subclusters.
(D) The bar chart showcases the differences in immune infiltration cells between the two cuproptosis subclusters.