
Figures & data
Table 1. Characteristics of the study population.
Figure 1. Cluster identification. The upper figure shows the hierarchical clustering dendrogram with three clusters. The lower figure shows the factor map from the principal component analysis. Each individual is represented by label, depending on the cluster: a green circle (subphenotype A), a blue triangle (subphentopye B), or a red square (subphenotype C).
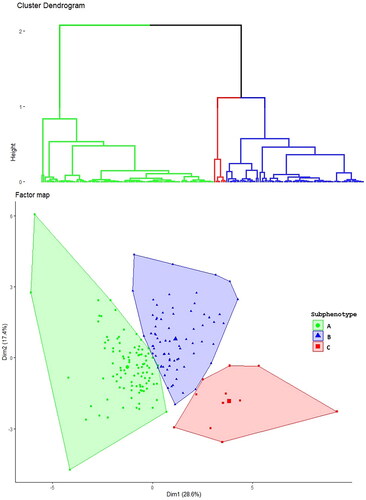
Figure 2. Vtest graph, showing the variables that contribute to the different subphenotypes. The Vtest graph characterizes the groups in terms of the variables whose average is lower or higher than in the total sample. Each bar represents the distance (in multiples of the standard deviation) between the within-class mean value and the total cohort mean value. TIMP-2: tissue inhibitor of metalloproteinases-2; IGFBP-7: insulin-like growth factor-binding protein 7; SCr: serum creatinine; eGFR: estimated glomerular filtration rate.
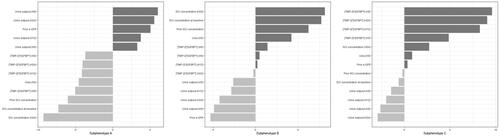
Figure 3. Proportions of patients with in-hospital death, renal replacement therapy initiation, and reversible AKI in the different subphenotype groups.
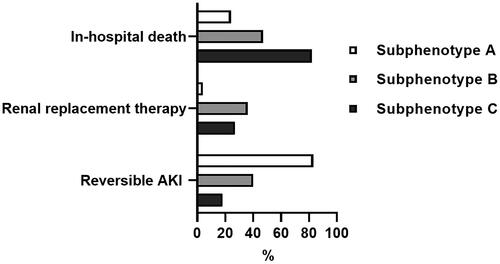
Figure 4. Crude composite in-hospital survival (no death or RRT initiation) curve for the different subphenotypes.
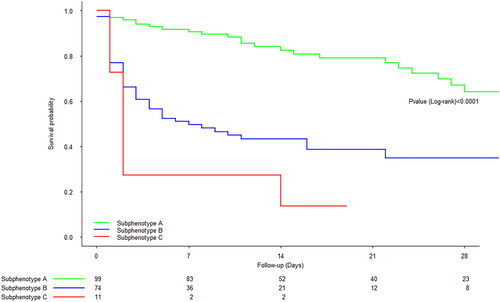
Figure 5. Adjusted composite in-hospital survival (no death or RRT initiation) curve for the different subphenotypes. With subphenotype A as the reference, the adjusted hazard ratio (aHR) [95%CI] for the composite in-hospital survival was 3.77 [1.92–7.42] (p < 0.001) for subphenotype B and 4.80 [1.67–13.82] (p = 0.004) for subphenotype C. Adjusted for age, renin–angiotensin system inhibitors, the nonrenal SOFA score at inclusion, lactate at inclusion, SAPS II, dobutamine support over the first 24 h, and fluid administered over the first 24 h.
![Figure 5. Adjusted composite in-hospital survival (no death or RRT initiation) curve for the different subphenotypes. With subphenotype A as the reference, the adjusted hazard ratio (aHR) [95%CI] for the composite in-hospital survival was 3.77 [1.92–7.42] (p < 0.001) for subphenotype B and 4.80 [1.67–13.82] (p = 0.004) for subphenotype C. Adjusted for age, renin–angiotensin system inhibitors, the nonrenal SOFA score at inclusion, lactate at inclusion, SAPS II, dobutamine support over the first 24 h, and fluid administered over the first 24 h.](/cms/asset/2a1fa822-13b7-4dc6-9c77-5e0ac905d3a3/irnf_a_2325640_f0005_c.jpg)