Figures & data
Figure 1. Obesity and disturbances in blood glucose and lipids were observed in rats that were fed a high-fat diet. (A) Variations in body weight between the two groups. (B) Lee’s index in the two groups of rats at week 24. (C) Levels of glucose in the blood of the two groups. (D–G) Levels of triglyceride (TG), cholesterol (CHO), high-density lipoprotein (HDL), and low-density lipoprotein cholesterol (LDL-c) in both groups of rats. ND refers to a normal diet, while HFD stands for high-fat diet. * p < 0.05,** p < 0.01,*** p < 0.001; n = 6–8 per group.
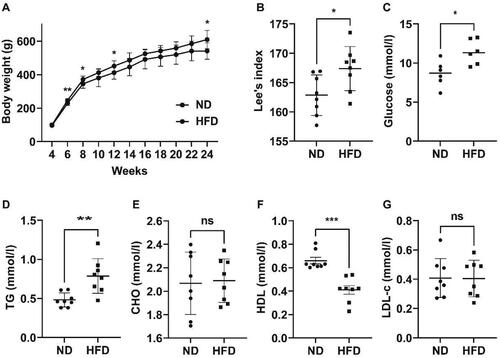
Table 1. Impact of a diet high in fat on kidney function in rats.
Figure 2. Pathological alterations in the kidneys of rats induced by a high-fat diet. (A) Representative images of HE staining of renal tissues (magnification = 30×, scale bar = 100 μm). (B) The sizes of the glomeruli in the two groups of rats. ND, normal diet; HFD, high-fat diet. Data are displayed as the mean ± SD. * p < 0.05 vs. the ND group; n = 8 per group.
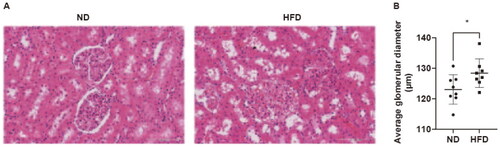
Figure 3. A high-fat diet induces significant alterations in the abundance of intestinal microbial populations in rats. (A, B) Comparison of intestinal microbial populations in the two groups of rats at the species level based on principal component analysis and non-metric multidimensional scaling analysis. (C) Variations in the abundance of the top 12 phyla of intestinal microbial populations in the two groups. (D) Heatmap to visualize the species that exhibit differential expression in the intestinal microbial populations of the two groups of rats; n = 4 per group.
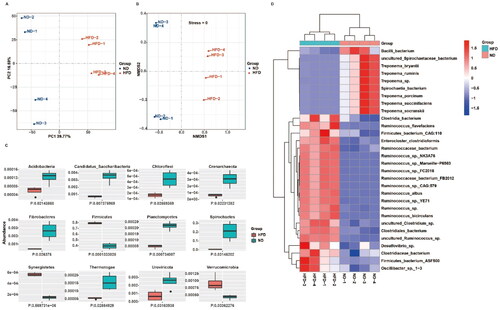
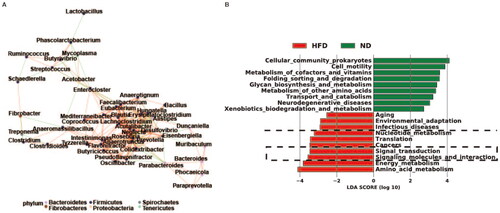
Figure 4. Interactions and functions of gut bacterial communities in obese rats. (A) Correlation network between bacterial species exhibiting varying abundance in the guts of the ND and HFD groups. (B) Linear discriminant analysis coupled with effect size measurement analysis shows the top 10 functions of differentially abundant bacterial species in the intestines of the two groups of rats. ND, normal diet; HFD, high-fat diet; n = 4 per group.