
Figures & data
Figure 1. The flowchart of the study.
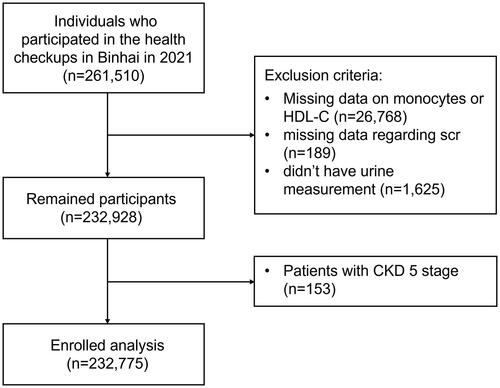
Table 1. Clinical characteristics of the population by MHR quartiles.
Figure 2. Prevalence of CKD according to the quartile of MHR. The prevalence of CKD according to the quartiles of MHR was shown in different colored bars (dark blue: CKD stage G1, brown: CKD stage G2, gray: CKD stage G3, light blue: CKD stage G4). MHR: monocyte to high-density lipoprotein cholesterol ratio; CKD: chronic kidney disease.
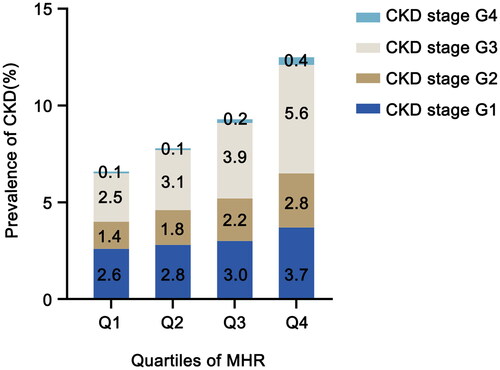
Table 2. Univariate logistic analysis of the relationships between the other variables and CKD.
Table 3. Multivariate logistic analysis of the association between MHR (per-1 SD increase) and the presence of CKD, low eGFR, and proteinuria.
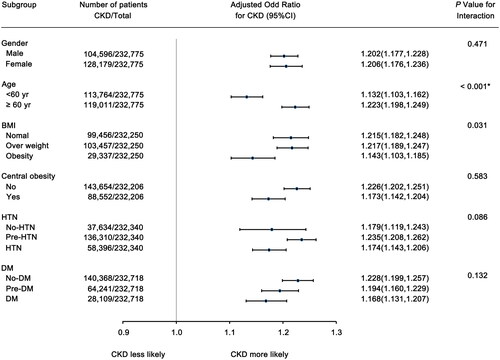
Figure 3. The odds ratio (95% CI) of MHR (per 1 SD increase) for CKD in subgroups. The odds ratio (95% CI) of per 1 SD increase of MHR for CKD, were adjusted for age, gender, BMI, FBS, SBP, DBP, total cholesterol, SUA, triglyceride, central obesity (yes or no), Hb, WBC, PLT, and LDL-C. *represents statistical significance after the Bonferroni Correction.
Supplemental Material
Download MS Word (33.4 KB)Data availability statement
The datasets used in this work are accessible upon reasonable request from the corresponding author.