
Figures & data
Figure 1. Myofibroblast-derived exosomes are associated with MMT. (a) Diagram depicting the experimental scheme. Kidney fibroblasts were treated with TGF-β1 (5 ng/ml) for 48 hours, PKH26-labeled exosomes from the conditioned media of myofibroblasts were incubated with cells for 24 h. (b) Immunostaining, scale bar, 50 μm. (c) Western blot shows the expressions of α-SMA. (d) Graphic presentation depicting the relative abundance for α-SMA normalized to β-actin in each group. (e) Western blot shows the expressions of CD63. (f) Graphic presentation depicting the relative abundance for CD63 normalized to β-actin in each group. (g) TEM displays the exosomes isolated from conditioned media of kidney fibroblasts stimulated by TGF-β1 (Myo-Exo). Scale bar, 200 nm. (h) Immunostaining depicting myofibroblast-derived exosomes (red) was taken up by macrophages. α-SMA: α-smooth muscle actin; MMT: transition of macrophages into myofibroblasts; PKH26: a specific dye for exosomes. **p <0.01 vs. Ctrl. n = 6 in each group.
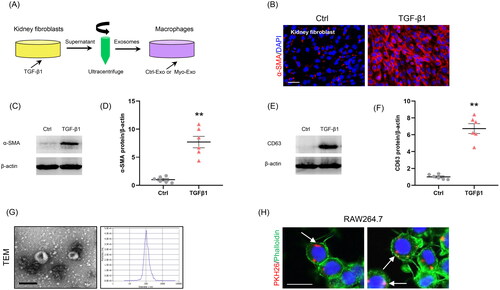
Figure 2. Myofibroblast-derived exosomes promote MMT in vitro. (a, b) Representative micrographs depicting the immunostaining for F4/80 or CD206 (red) and α-SMA (green) dual positive cells in cultured RAW264.7 cells exposed to exosomes isolated from kidney fibroblasts treated with or without TGF-β1. (c, d) Graphic presentation depicting the number of dual positive cells in each group. (e) Western blot depicting α-SMA abundance in RAW264.7 cells lysate, n = 6 in each group. (f) Graphic presentation depicting the relative abundance for α-SMA normalized to β-actin in each group. α-SMA: α-smooth muscle actin; MMT: transition of macrophages into myofibroblasts. White arrows represent double positive cells, red arrows represent single positive cells. Scale bar, 50 μm. +p <0.05 or ++p <0.01 vs. TGFβ1-CM/Exo-out; **p <0.01 vs. Ctrl-CM/Exo-in; #p <0.05 or ##p <0.01 vs. TGFβ1-CM/Exo-in. n = 3 in each group.
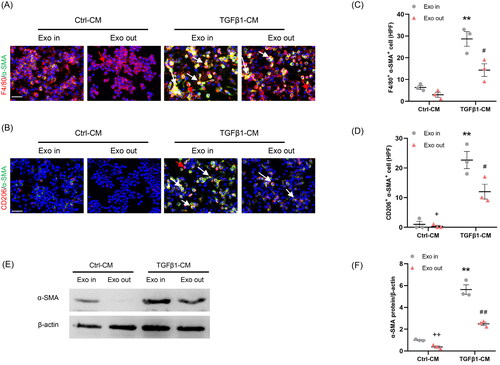
Figure 3. Inhibition of the exosome release from myofibroblasts impairs MMT in vitro. (a) Diagram depicting the experimental scheme. Kidney fibroblasts of mice were treated with TGF-β1 or GW4869. CM from kidney fibroblasts is harvested to stimulate RAW264.7 cells. (b) Western blot depicting CD63 abundance in CM of each group, n = 6 in each group. (c) Graphic presentation depicting the relative abundance for CD63 normalized to β-actin in each group. (d, e) Representative micrographs depicting the immunostaining for F4/80 or CD206 (red) and α-SMA (green) dual positive cells in cultured RAW.264.7 cells exposed to conditioned media from kidney fibroblasts treated with TGF-β1 or GW4869. (f, g) Graphic presentation depicting the number of dual positive cells in each group. (h) Western blot depicting and α-SMA abundance in RAW264.7 cells lysate. (i) Graphic presentation depicting the relative abundance for α-SMA normalized to β-actin in each group. CM: conditioned media; α-SMA: α-smooth muscle actin; MMT: transition of macrophages into myofibroblasts. White arrows represent double positive cells; red arrows represent single positive cells. Scale bar, 50 μm.**p <0.01 vs. Ctrl-CM; #p <0.05 or ##p <0.01 vs. TGFβ1-CM. n = 3 in each group.
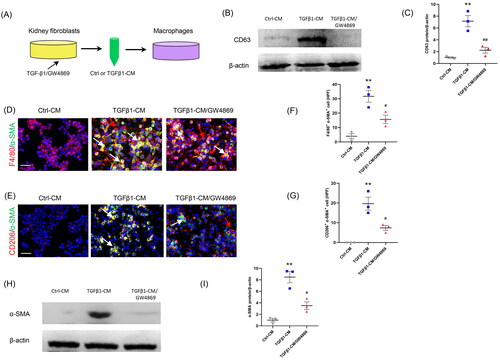
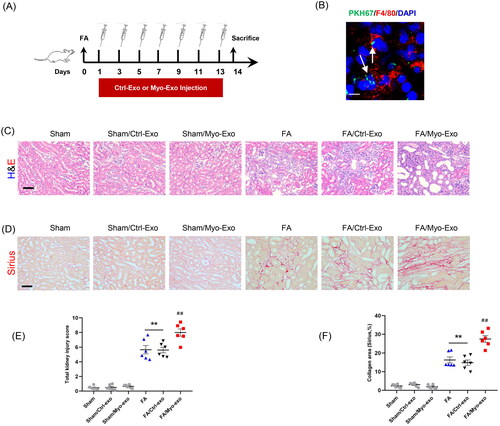

Figure 5. Myofibroblast-derived exosomes promote MMT and myofibroblast accumulation in kidneys of mice. (a, b) Representative micrographs depicting the immunostaining for F4/80 or CD206 (red) and α-SMA (green) dual positive cells in kidneys of mice in each group. (c, d) Graphic presentation depicting the number of dual positive cells in each group. (e) Representative micrographs and (f) graphic presentation depicting the immunostaining for α-SMA (red) in kidneys of mice in each group. (g) Western blot depicting α-SMA abundance in kidneys lysate. (h) Graphic presentation depicting the relative abundance for α-SMA normalized to β-actin in each group. CM: conditioned media; α-SMA: α-smooth muscle actin. White arrows represent double positive cells, red arrows represent single positive cells. +p <0.05 or ++p < 0.01 vs. FA/Myo-Exo; ##p < 0.01 vs. Sham/Myo-Exo. Scale bar, 50 μm, n = 6 in each group.
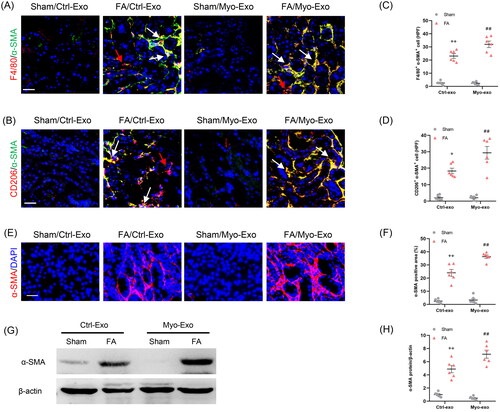
Figure 6. Inhibition of exosomes ameliorates kidney fibrosis in mice. (a) Diagram depicting the experimental scheme. Mice were subjected to FA injection for 14 days to induce kidney fibrosis with vehicle or GW4869 injection. (b) Western blot depicting CD63 abundance in kidneys of each group. (c) Graphic presentation depicting the relative abundance for CD63 normalized to β-actin in each group. (d) Sirius red staining and (e) graphic presentation depicting collagen deposition in kidneys of mice in each group. (f, g) Representative micrographs. (h, i) Graphic presentation depicting the immunostaining for FN (green) and collagen 1 (green) in kidneys of mice in each group. (j) Western blot depicting collagen 1 abundance in kidneys lysate. (k) Graphic presentation depicting the relative abundance for collagen 1 normalized to β-actin in each group. GW4869: inhibition of exosome production; CD63: exosomal marker. **p < 0.01 vs. Sham; ##p < 0.01 vs. FA. Scale bar, 50 μm, n = 6 in each group.
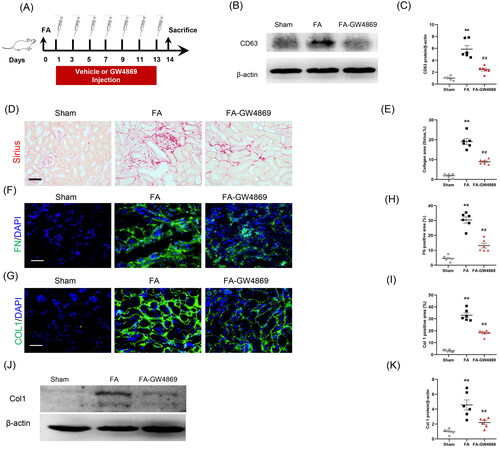
Figure 7. Inhibition of exosomes blunts MMT and myofibroblast accumulation in kidneys of mice. (a, b) Representative micrographs depicting the immunostaining for F4/80 or CD206 (red) and α-SMA (green) dual positive cells in kidneys of mice in each group. (c, d) Graphic presentation depicting the number of dual positive cells in each group. (e) Representative micrographs and (f) graphic presentation depicting the immunostaining for α-SMA (red) in kidneys of mice in each group. (g) Western blot depicting α-SMA abundance in kidneys cells lysate. (h) Graphic presentation depicting the relative abundance for α-SMA normalized to β-actin in each group. α-SMA: α-smooth muscle actin. White arrows represent double positive cells, red arrows represent single positive cells. **p < 0.01 vs. Sham; ##p < 0.01 vs. FA. Scale bar, 50 μm, n = 6 in each group.
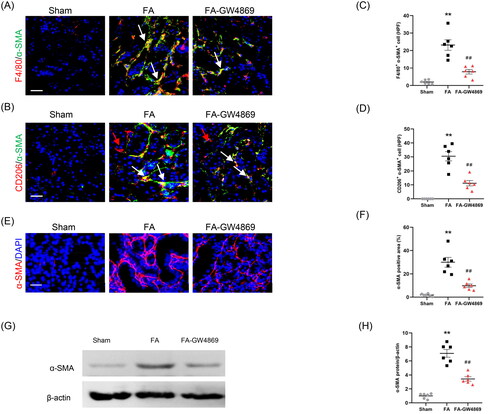
Figure 8. TBK1 inhibitor abolished the profibrotic effects of myofibroblast-derived exosomes. (a) Diagram depicting the experimental scheme. (b) Representative micrographs depicting the immunostaining for phosph-TBK1 positive cells in kidneys of mice in each group. (c) Graphic presentation depicting the number of phosph-TBK1 positive cells in each group. (d) Western blot depicting TBK1 abundance in kidneys cells lysate. (e) Graphic presentation depicting the relative abundance for p-TBK1 normalized to TBK1 in each group. (f) Sirius red staining. (g) Representative micrographs. (h) Graphic presentation depicting the immunostaining for FN (green) in kidneys of mice in each group. (i) Representative micrographs. (j) Representative micrographs depicting the immunostaining for F4/80 (red) and α-SMA (green) dual positive cells in kidneys of mice in each group. (k) Graphic presentation depicting the number of dual positive cells in each group. (l) Graphic presentation depicting the immunostaining for α-SMA (red) in kidneys of mice in each group. (m) Representative micrographs. (n) Western blot depicting TBK1 abundance in RAW.264.7 cells. (p) Representative micrographs (q) Representative micrographs depicting the immunostaining for F4/80 (red) and α-SMA (green) dual positive cells in cultured RAW.264.7 cells exposed to Myo-Exo or GSK in each group. (r) Representative micrographs. α-SMA: α-smooth muscle actin. White arrows represent double positive cells, red arrows represent single positive cells. Scale bar, 50 μm. +p < .05 vs. FA/Myo-Exo/GSK or Myo-Exo/GSK; **p < 0.01 vs. Sham or FA/Myo-Exo or vehicle; #p < 0.05 or ##p < 0.01 vs. FA/Myo-Exo or Myo-Exo. Scale bar, 50 μm, n = 6 in each group.
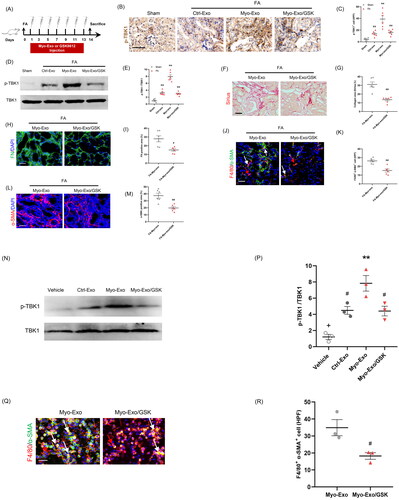
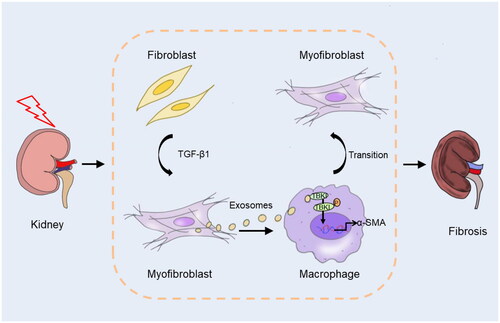
Figure 9. Graphical abstract. In response to stress, kidney fibroblasts differentiate into myofibroblasts. Exosomes derived from myofibroblasts activate TBK1 in macrophage, resulting in macrophage to myofibroblast transition and kidney fibrosis.
Data availability statement
The data used to support the findings of this study are available from the corresponding authors upon request.