Figures & data
Table 1. The basic characteristics of study participants.
Figure 1. Relationship of serum total cholesterol levels (A) and triglyceride levels (B) with the risk of all-cause mortality*. *Adjusted for age, sex, dialysis center, diabetes, hypertension and history of CVD, smoking, alcohol drinking, lipid-lowering agent use, dialysis vintage, Kt/V ratio, BMI, waist:hip ratio, albumin, serum calcium, hemoglobin, CRP (log10 transformed), dietary energy intake, dietary cholesterol intake and serum triglyceride or serum total cholesterol.
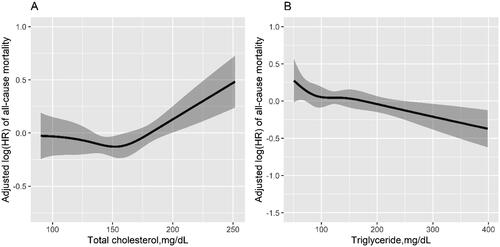
Table 2. The association between total cholesterol levels and the risk of mortality.
Table 3. The association between triglyceride levels and the risk of mortality.
Figure 2. Joint association of TC and TG with all-cause mortality (A) and CVD mortality (B)*. *Adjusted for age, sex, dialysis center, diabetes, hypertension and history of CVD, smoking, alcohol drinking, lipid-lowering agent use, dialysis vintage, Kt/V ratio, BMI, waist:hip ratio, albumin, serum calcium, hemoglobin, CRP (log10 transformed), dietary energy intake, dietary cholesterol intake.
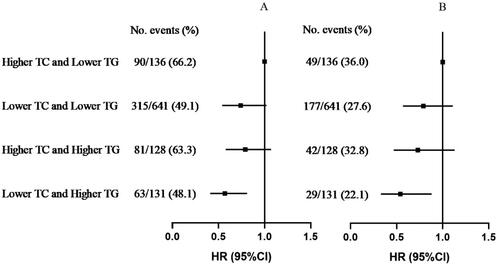
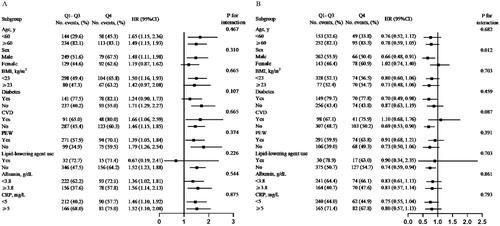
Figure 3. Stratified analysis of the association between serum total cholesterol (A), triglyceride (B) and the risk of all-cause mortality*. *Adjusted for age, sex, dialysis center, diabetes, hypertension and history of CVD, smoking, alcohol drinking, lipid-lowering agent use, dialysis vintage, Kt/V ratio, BMI, waist:hip ratio, albumin, serum calcium, hemoglobin, CRP (log10 transformed), dietary energy intake, dietary cholesterol intake and serum triglyceride or serum total cholesterol.