
Figures & data
Table 1. Comparison of animal models of CKD induced by a variety of approaches.
Figure 1. Adenine metabolism pathways. APRT: adenine phosphoribosyl transferase; PRPP: 5-phosphoribosyl-1-pyrophosphate; AMP: adenosine monophosphate; IMP: inosine monophosphate; AMPD1: adenosine monophosphate deaminase 1; ADA: adenosine deaminase; PNP: purine nucleoside phosphorylase; XO: xanthine oxidase; PRPS1: phosphoribosyl pyrophosphate synthetase 1; PRPPs: phosphate diphosphokinase; ADSL: adenylosuccinate lyase; ATIC: 5-aminoimidazole-4-carboxamide ribonucleotide formyltransferase/IMP cyclohydrolase; ADSS: Adenylosuccinate synthase 2; ADP: adenosine diphosphate; ATP: adenosine triphosphate; AdeR: adenine receptors.
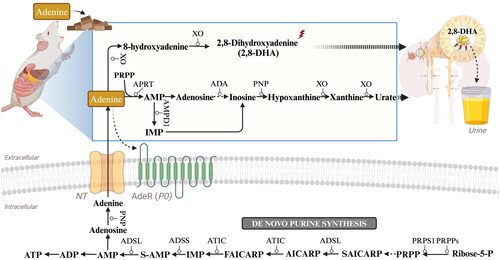
Figure 2. General experimental scheme of adenine-induced CKD. Adenine is usually given at a dose of 0.75% w/w for rats or 0.20% w/w for mice, and is mixed into normal diets for ad libitum consumption (note: it is advisable to add a certain level of casein to the diets for mice). The progression of CKD may be studied for up to, or beyond, 4 weeks following the start of adenine feed administration.
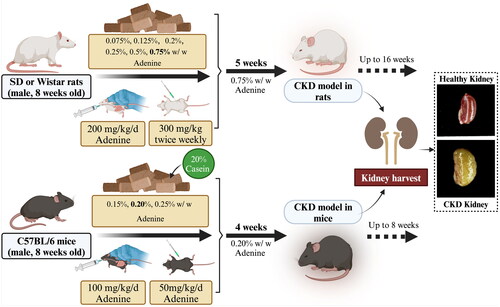
Figure 3. Process of 2,8-DHA crystal granuloma formation. Supersaturation of 2,8-DHA in the urine leads to the formation of 2,8-DHA crystal nuclei. These nuclei adhere to renal tubular cells, creating a nidus for further crystal growth and leading to the formation of crystal plugs in the tubular lumen, causing obstruction of the tubules. Very small crystal plugs were internalized and likely degraded by renal tubular cells, while medium-sized crystal plugs trigger dedifferentiation and proliferative growth of renal tubular cells, eventually resulting in the translocation of plugs into the interstitium. Within the interstitial compartment, renal tubular cells cooperate with macrophages and other cells in the formation of interstitial crystal granulomas that isolate the crystal plug from the renal parenchyma and initiate crystal degradation.
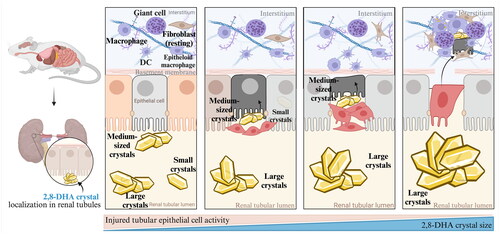
Figure 4. Processes of the primary mechanism of adenine-induced renal inflammation.
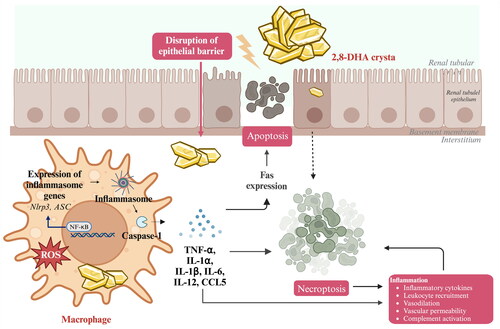
Figure 5. Processes of the major mechanism of adenine-induced renal oxidative stress.
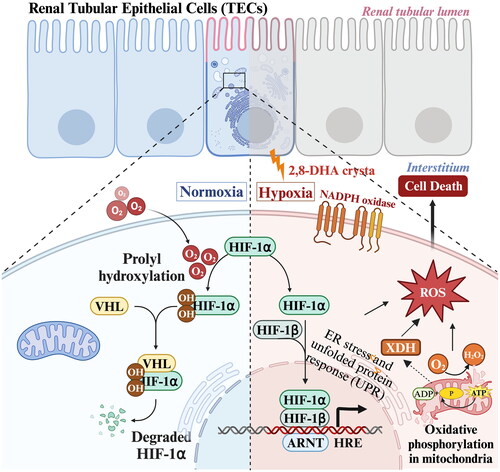
Figure 6. Processes of the major mechanism of adenine-induced renal programmed cell death.
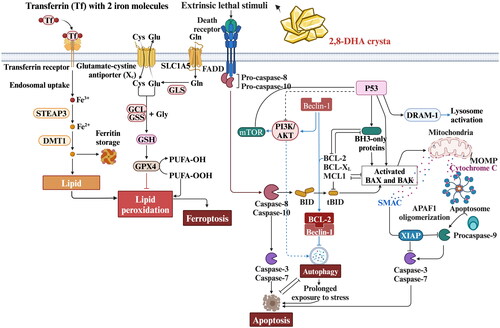
Figure 7. Processes of the major mechanism of adenine-induced renal metabolic disorders.
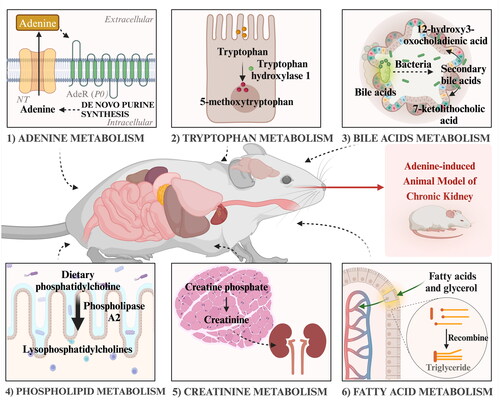
Figure 8. Processes of the major mechanism of adenine-induced renal fibroblast/myofibroblast activation.
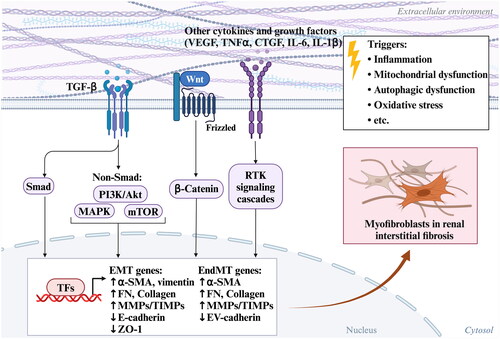
Table 2. Adenine-induced animal models for testing therapeutic interventions in CKD.