Figures & data
Table 1. Baseline characteristics of the participants.
Table 2. Pre-HD SNa and ΔSNa of the participants.
Table 3. Cox proportional hazards models of pre-HD SNa for all-cause mortality and cardio-cerebrovascular event.
Table 4. Cox proportional hazards models of ΔSNa for all-cause mortality and cardio-cerebrovascular event.
Table 5. Adjusted hazard ratio associated with stratification by pre-HD SNa and ΔSNa.
Figure 1. Multivariable-adjusted restricted cubic spline plots of pre-HD SNa for (A) all-cause mortality, with adjustment of age, BMI, CCVD history, SCr, and Alb; and for (B) cardio-cerebrovascular event, with adjustment of age, BMI, CCVD history, CRP and Ferr. Grey, blue, orange and red color represent the RCS curves of baseline pre-HD SNa, 1-year pre-HD SNa, 2-year pre-HD SNa and 3-year pre-HD SNa, respectively. Shadow represents the 95% confident interval.
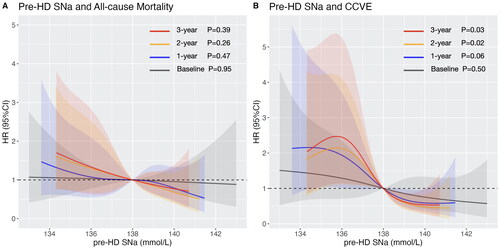
Figure 2. Multi-variable restricted cubic spline plots of ΔSNa for (A) all-cause mortality with adjustment of age, BMI, CCVD history, SCr, and Alb; and for (B) cardio-cerebrovascular event, with adjustment of age, BMI, CCVD history, CRP and Ferr. Grey, blue, orange and red color represent the RCS curves of baseline ΔSNa, 1-year ΔSNa, 2-year ΔSNa and 3-year ΔSNa. Shadow represents the 95% confidence interval.
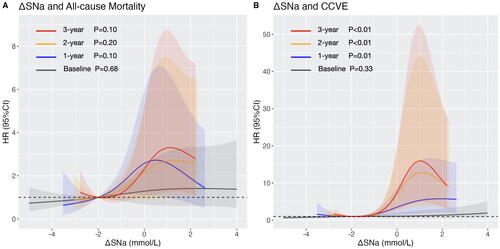
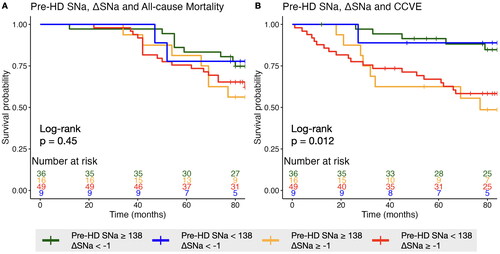
Figure 3. Kaplan-Meier plots stratified by 3-year average pre-HD SNa and ΔSNa for (A) all-cause mortality and (B) cardio-cerebrovascular event. Significance was examined by Log-rank test.