
Figures & data
Table 1. The primer sequences used in this study.
Figure 1. The location of HMGB2 in CD19+ B lymphocytes. Ficoll-Paque Plus density gradient centrifugation was used to produce peripheral blood mononuclear cells. Immunomagnetic beads tagged with an anti-human CD19+ antibody were used to extract CD19+ B cells. Representative image of B lymphocytes stained by multiplex IHC. Scale bar, 1000 μm. DAPI (blue), CD19+ (red), HMGB2 (green).
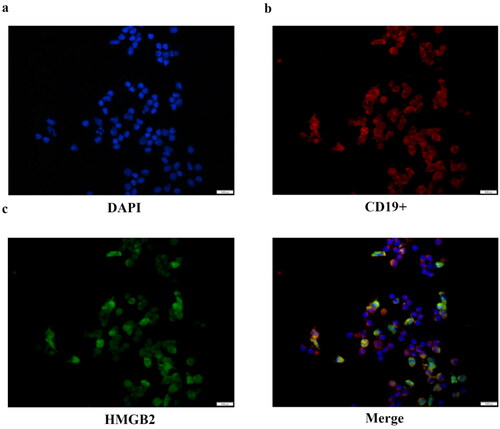
Figure 2. The expression level of HMGB2 in IgAN patients and the correlation between HMGB2 and APRIL in CD19+ B lymphocytes. (a) Peripheral blood was drawn from normal controls (n = 6) and IgAN patients (n = 17), and B cells were isolated for RNA extraction. qRT-PCR was used to detect the expression level of HMGB2. p = 0.021. (b) The expression levels of HMGB2 and APRIL were measured by qRT–PCR. Spearman’s correlation test was used to analyze the correlation between HMGB2 and APRIL. R = 0.517, p = 0.034.
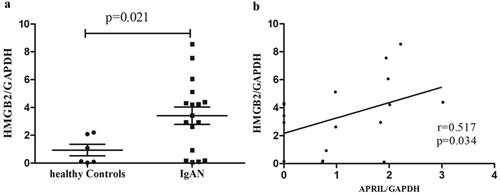
Figure 3. The expression levels of APRIL and Gd-IgA1 after HMGB2 knockdown in the DAKIKI cell line. DAKIKI cells were transfected with si-NC, HMGB2 siRNA1, or HMGB2 siRNA2. The control group was untreated DAKIKI cells. (a) The protein expression level of HMGB2 was detected by Western blot. (b) Densitometric analysis of the WB signals. (c) The mRNA level of HMGB2 was measured by qRT–PCR. (d) The mRNA expression level of APRIL was measured by qRT–PCR. (e) The expression level of Gd-IgA1 in the cell culture supernatant was determined by enzyme-linked immunosorbent assay (ELISA). The experiments were repeated three times. The data are presented as the mean ± SD. *p < 0.05; **p < 0.01; ***p < 0.001; ****p < 0.0001; ns: not significant.
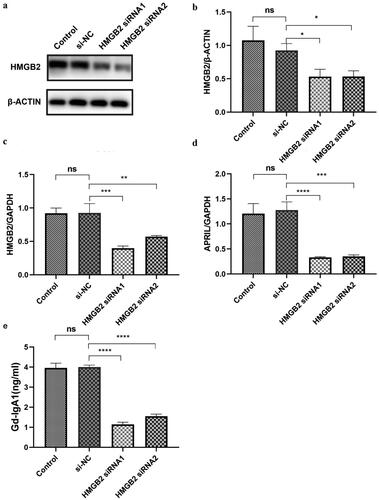
Figure 4. Electrophoresis diagram of agarose and SDS–PAGE gel diagram. (a) Agarose electrophoresis map of the DNA probes; (b) SDS–PAGE gel diagram of DNA pull-down.
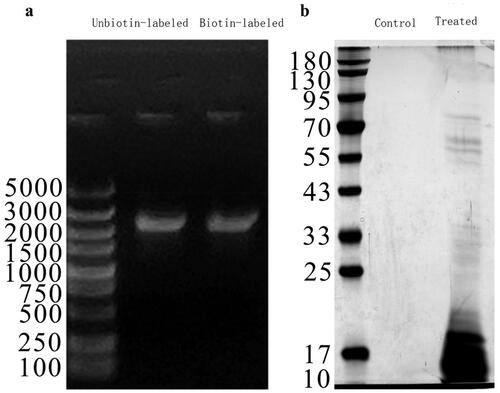
Figure 5. HMGB2 combined with HMGA1 and HMGA1 may regulate the expression of APRIL and Gd-IgA1. (a) The PPI network shows the relationships of proteins that bind to the promoter region of TNFSF13 with HMGB2. These small circles represent proteins, and the lines linking two proteins represent interactions between proteins. (b–d) DAKIKI cells were transfected with si-NC, HMGB2 siRNA1, or HMGB2 siRNA2. The control group was untreated DAKIKI cells. The protein expression of HMGB2 and HMGA1 after HMGB2 knockdown in DAKIKI cells were decreased. (e) The lysate was immunoprecipitated with an anti-HMGB2 antibody. Western blotting was used to detect the expression of HMGB2 and HMGA1. The experiments were repeated three times. The data are presented as the mean ± SD. *p < 0.05; **p < 0.01, ns not significant.
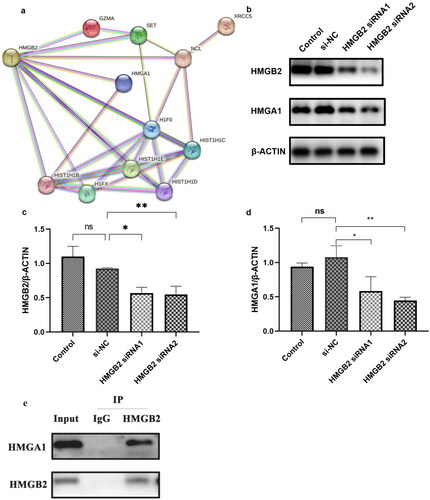
Figure 6. The expression levels of HMGA1, APRIL and Gd-IgA1 in HMGA1-knockdown DAKIKI cells. DAKIKI cells were transfected with si-NC or HMGA1 siRNA. The control group was untreated DAKIKI cells. (a,b) Western blotting and qRT–PCR were used to verify the efficiency of HMGA1 siRNA knockdown. (c) The mRNA expression level of APRIL detected by qRT-PCR. (d) The concentration of Gd-IgA1 in cell supernatants was determined by ELISA. The experiments were repeated three times. The data are presented as the mean ± SD. ***p < 0.001; ****p < 0.0001; ns: not significant.
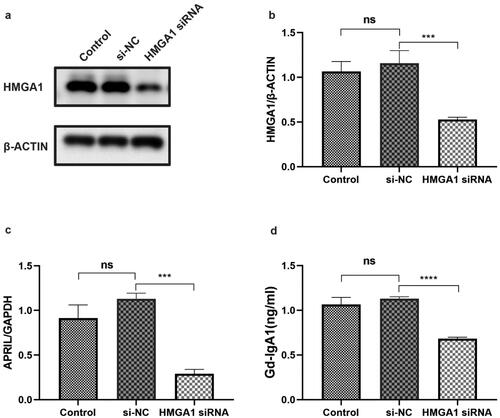
Table 2. The position and sequence of HMGA1 bound to the APRIL-encoding gene TNFSF13.
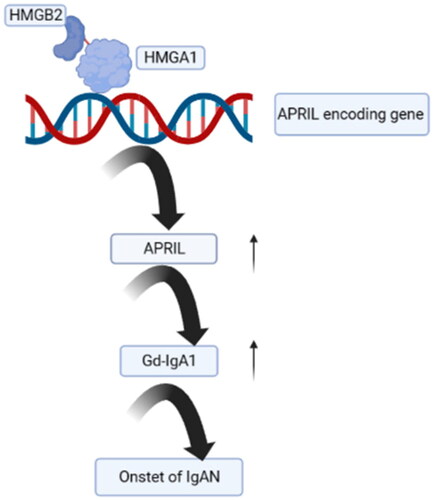
Figure 7. Hypothesis diagram: HMGB2 can promote the expression of APRIL by binding to HMGA1, leading to the onset of IgAN.
Supplemental Material
Download PDF (703.1 KB)Data availability statement
Raw data used during the current study are available from the corresponding author on reasonable request for noncommercial use.