
Figures & data
Table 1. The sequences of the PCR primers in this study.
Table 2. Animal characteristics.
Figure 1. Effects of TXNIP deficiency on renal fibrosis in diabetic kidneys. (A) Renal pathological changes were examined by PAS staining, Sirius red staining and Masson trichrome staining (Bar = 50 μm). Glomerular injury index for PAS staining (B) and tubulointerstitial injury index for Masson trichrome staining (C) were measured. (D) The expression of collagen I was detected by immunofluorescence (Bar = 50 μm). (E) The mRNA levels of collagen I and fibronectin were analyzed by RT-qPCR. (F, G) The expression of TXNIP, collagen I and fibronectin was analyzed by western blotting. ****p < 0.0001; 0.0001 <***p < 0.001; 0.01<*p < 0.05.
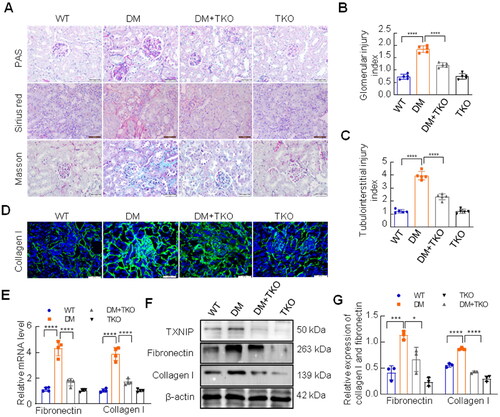
Figure 2. Effects of TXNIP deficiency on activation of mTORC1 and TFEB, and autophagy in diabetic kidneys. (A, B) The expression of p-p70S6K and p70S6K was analyzed by western blotting. (C) Immunohistochemical staining with TFEB antibody (Bar = 50 μm), and semi-quantitative analysis for TFEB (D). (E) Immunofluorescence staining with TFEB antibody, and yellow arrows displayed nuclear TFEB or tubular nuclear(Bar = 20 μm). Western blotting was implemented to examined the levels of total TFEB (F, G), nuclear TFEB and cytoplasmic TFEB (H, I), LC3B and p62 (J, K). (L) Autophagic vacuoles in renal tubular cells were observed by the transmission electron microscope, and yellow arrows represented autophagic vacuoles (bar = 2 μm, or 1 μm). ****p < 0.0001; 0.0001 <***p < 0.001; 0.001 <**p < 0.01; 0.01 <*p < 0.05.
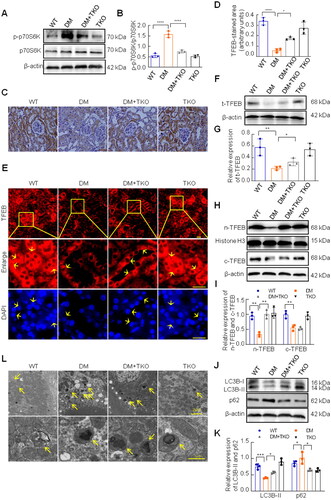
Figure 3. Effects of TXNIP deficiency on fibrotic responses in HK-2 cells exposed to HG. The mRNA and protein levels of TXNIP were analyzed by RT-qPCR and western blotting respectively (A–C). (D) The mRNA levels of fibronectin, collagen I, α-SMA and E-cadherin were assessed by RT-qPCR. (E–G) The expression of fibronectin, collagen I, E-cadherin and α-SMA was analyzed by western blotting. (H) E-cadherin and α-SMA was detected by immunoinfluorence (bar = 25 μm). (I) Morphological alterations of HK-2 cells were observed by the inverted microscope (bar = 50 μm). ****p < 0.0001; 0.0001 < ***p < 0.001; 0.001 <**p < 0.01; 0.01 <*p < 0.05.
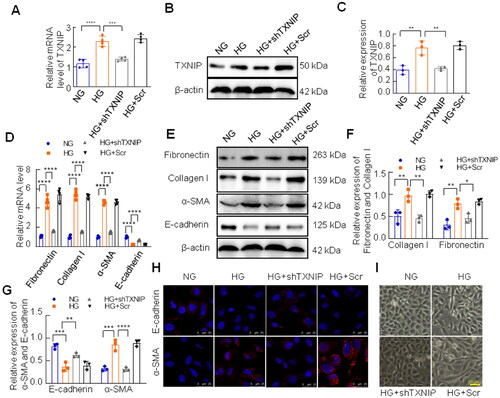
Figure 4. Effects of TXNIP deficiency on activation of mTORC1 and TFEB, as well as autophagy in HK-2 cells exposed to HG. (A, B) The expression of p-p70S6K and p70S6K was analyzed by western blotting. (C) The expression of TFEB, LC3B and p62 was examined in HK-2 cells by immunofluorescence (Bar = 25 μm). The expression of cytoplasmic TFEB, nuclear TFEB and total TFEB (D–G), LC3B and p62 (H, I) was analyzed by western blotting. ****p < 0.0001; 0.0001 <***p < 0.001; 0.001 <**p < 0.01; 0.01 <*p < 0.05.
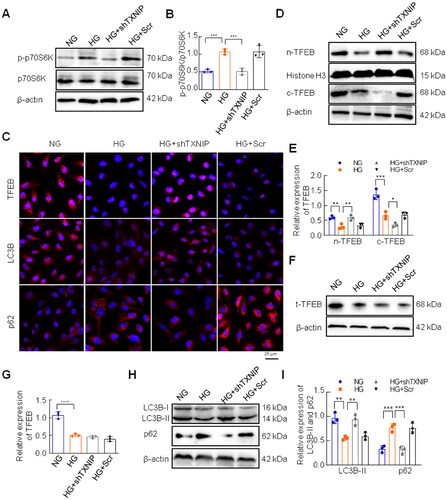
Figure 5. Effects of inhibition of mTORC1 on activation of TFEB and autophagy in HK-2 cells under high glucose conditions. (A, B) The expression of p-p70S6K and p70S6K was analyzed by western blotting. (C, D) The expression of cytoplasmic TFEB and nuclear TFEB was analyzed by western blotting. (E) Immunofluorescence staining for TFEB was conducted in HK-2 cells (Bar = 25 μm). Western blotting (F, G) and immunofluorescence staining (H) were performed to examine the expression of LC3B and p62 (Bar = 25 μm). ****p < 0.0001; 0.0001 <***p < 0.001; 0.001 <**p < 0.01; 0.01 <*p < 0.05.
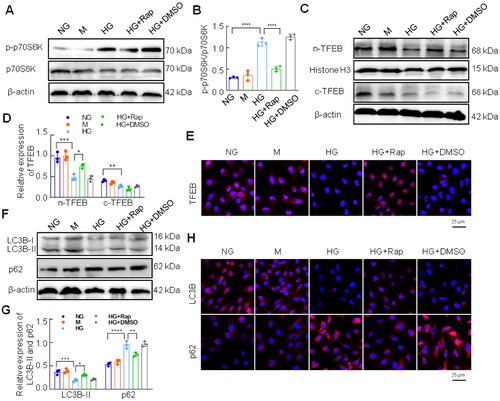
Figure 6. Effect of activated TFEB on autophagy flux in HK-2 cells exposed to HG. (A, B) The expression of cytoplasmic TFEB and nuclear TFEB was analyzed by western blotting. (C, D) Western blotting analysis for the expression of LC3B and p62. (E) Autophagic vacuoles in HK-2 cells were observed by the transmission electron microscope, and yellow arrows represented autophagic vacuoles (×4,000, or ×30,000). ****p < 0.0001; 0.0001 <***p < 0.001; 0.001 <**p < 0.01.
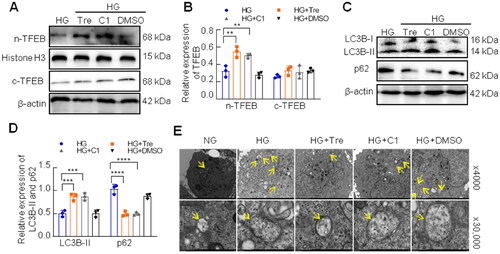
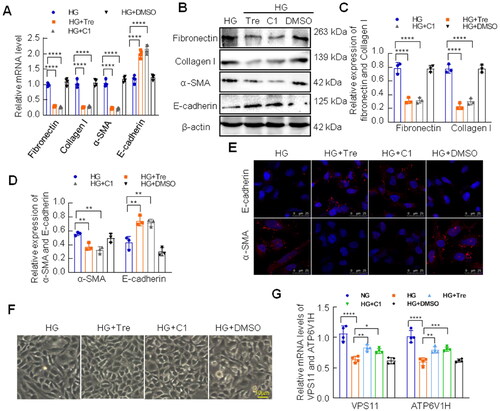
Figure 7. Effect of activated TFEB on EMT of HK-2 cells under HG conditions. (A) The mRNA levels of fibronectin, collagen I, α-SMA and E-cadherin were assessed by RT-qPCR. (B–D) The expression of fibronectin, collagen I, E-cadherin and α-SMA was analyzed by western blotting. (E) E-cadherin and α-SMA was detected by immunoinfluorence staining (Bar = 25 μm). (F) Morphological alterations of HK-2 cells were observed by the inverted microscope (Bar = 50 μm). (G) The mRNA levels of VPS11and ATP6V1H were assessed by RT-qPCR. ****p < 0.0001; 0.0001 <***p < 0.001; 0.001 <**p < 0.01; 0.01 <*p < 0.05.
Supplemental Material
Download PDF (74.4 KB)Data availability statement
The authors confirm that all the data supporting the results of this study are available within the article and from the corresponding authors upon reasonable request.