Figures & data
Table 1. Primers used for qRT-PCR analysis.
Figure 1. Knockdown of DKK3 alleviated renal injury and renal fibrosis in UUO mice. C57BL/6J mice were exposed to sham or UUO operation and UUO mice were treated with or without shDKK3. Each group had 6 mice. A&B. The protein level of Drp1 was detected by IHC and Western blotting, respectively. C. Serum CR level was measured by CR assay kit. D. Serum BUN level was measured by Urea Assay Kit. E–G. HE staining, Mason staining and PAS staining of mice kidney tissue in each group were detected. Scale bar, 50 μm. H. α-SMA, Fibronectin, TGF-β and E-cadherin in kidney tissue were measured by Western blotting. I. The apoptosis level was evaluated by TUNEL assay. Scale bar, 50 μm. J&K. The mRNA and protein expression of DKK3 were detected by qRT-PCR and Western blotting, respectively. Data were presented as mean ± SD. *p < 0.05, **p < 0.01 and ***p < 0.001.
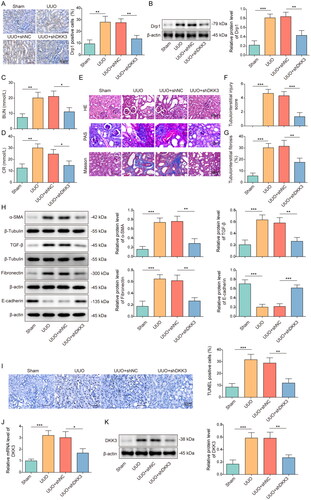
Figure 2. Knockdown of DKK3 suppressed oxidative stress and maintained mitochondrial homeostasis in UUO mice. C57BL/6J mice were exposed to sham or UUO operation and UUO mice were treated with or without shDKK3. Each group had 6 mice. A. 4-HNE was detected by IHC in each group. Scale bar, 50 μm. B. MDA was detected by the assay kit. C. SOD was detected by the assay kit. D. GPX was detected by the assay kit. E. The protein expressions of Mfn2, MFF, Drp1, YME1L and NOX4 in kidney tissue were measured by Western blotting. F. ATP content was detected in kidney tissues by the assay kit. Data were expressed as mean ± SD. *p < 0.05, **p < 0.01 and ***p < 0.001.
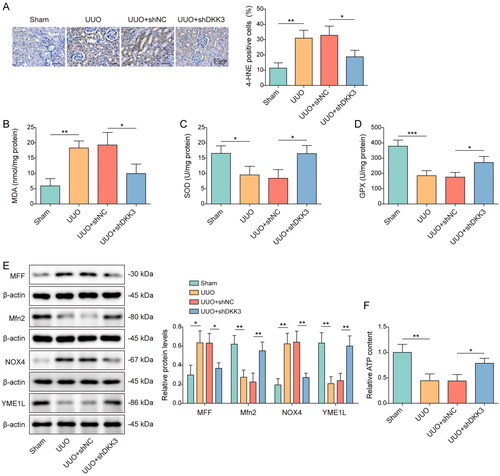
Figure 3. Knockdown of DKK3 inhibited H2O2-induced cell apoptosis and fibrosis in HK-2 cells. HK-2 cells transfected with shNC or shDKK3 were then treated with saline (control group) or 500 μM H2O2 for 48 h. A. The mRNA expression of DKK3 was detected by qRT-PCR. B. The protein expression of DKK3 was detected by Western blotting. C. Cell viability was examined by CCK-8 assay kit. D. Cell apoptosis was assessed by flow cytometry. E. The protein expressions of Bax, Bcl2, Cleaved-caspase 3 and Caspase 3 in HK-2 cells were measured by Western blotting. F. The protein expressions of α-SMA, Fibronectin, TGF-β and E-cadherin in HK-2 cells were measured by Western blotting. Data were presented as mean ± SD. *p < 0.05, **p < 0.01 and ***p < 0.001.
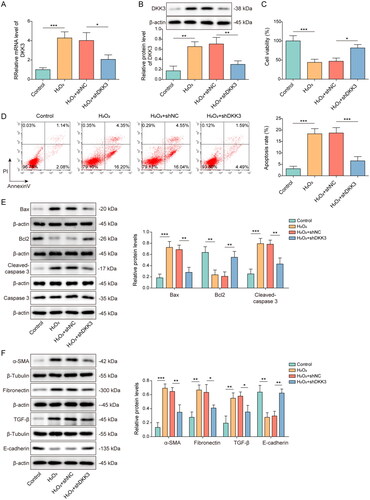
Figure 4. Knockdown of DKK3 repressed H2O2-induced oxidative stress and mitochondrial fission. HK-2 cells transfected with shNC or shDKK3 were treated with saline (control group) or 500 μM H2O2 for 48 h. A. Mitochondria ROS level was measured by mitoSOX assay kit. Scale bar, 100 μm and 20 μm. B. SOD was detected by the assay kit. C. MDA was detected by the assay kit. D. GPX was detected by the assay kit. E. Mitochondrial membrane potential was measured by JC-1 detection kit. F. The protein expressions of Mfn2, MFF, Drp1, YME1L and NOX4 in HK-2 cells were measured by Western blotting. Data were expressed as mean ± SD. *p < 0.05, **p < 0.01 and ***p < 0.001.
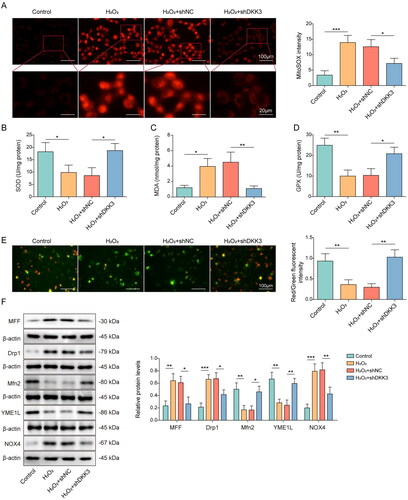
Figure 5. Upregulation of DKK3 was associated with METTL3-mediated m6A modification. A. Potential m6A sites on DKK3 mRNA were predicted by the SRAMP database. B. HK-2 cells were treated with H2O2. m6A level was detected by meRIP. C. The interaction between DKK3 and METTL3 was validated by RIP. HK-2 cells were treated with pcDNA3.1 or pcDNA3.1-METTL3. D&E. The mRNA levels of METTL3 and DKK3 were detected by qRT-PCR. F. The protein levels of METTL3 and DKK3 were detected by Western blotting. G&H. HK-2 cells were treated with STM2457 and the mRNA and protein level of DKK3 were detected by qRT-PCR and Western blotting, respectively. Data were presented as mean ± SD. *p < 0.05, **p < 0.01 and ***p < 0.001.
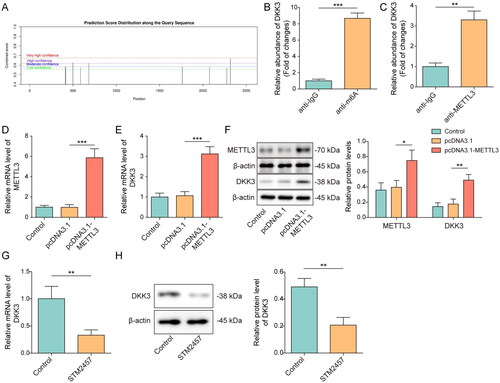
Figure 6. DKK3 promoted MFF transcription mediated by the TCF4/β-catenin complex. HK-2 cells transfected with shNC or shDKK3 were treated with saline (control group) or 500 μM H2O2 for 48 h. A. β-catenin was visualized by immunostaining. Scale bar, 20 μm. B. HK-2 cells were co-transfected with plasmids containing MFF’s promoter or pcDNA3.1-TCF4/pcDNA3.1-β-catenin. The luciferase activity of treated cells was detected. C. ChIP was utilized to detect the interaction between TCF4, β-catenin and MFF promoter. IgG was used as the negative control. D. MFF mRNA was detected by qRT-PCR. E. MFF protein was detected by Western blotting. F. HK-2 cells were treated with saline (control), pcDNA3.1, pcDNA3.1-DKK3, LF3 or pcDNA3.1-DKK3+ LF3. MFF mRNA was detected by qRT-PCR. G. MFF protein was detected by Western blotting. Data were expressed as mean ± SD. *p < 0.05, **p < 0.01 and ***p < 0.001.
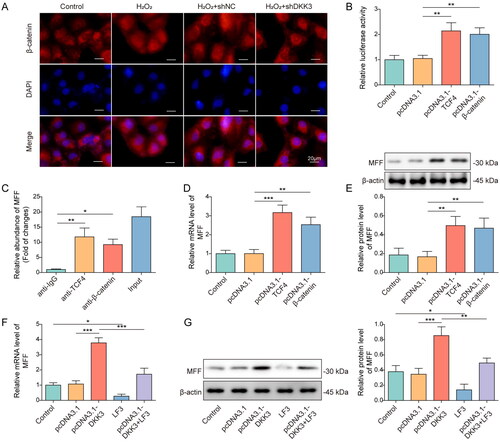
Figure 7. MFF overexpression reversed the effect of DKK3 silencing on biological activity in H2O2-treated HK-2 cells. A. MFF mRNA was detected by qRT-PCR in HK-2 cells transfected with pcDNA3.1-MFF. HK-2 cells were separated into the following groups: control, H2O2, H2O2+shNC + pcDNA3.1, H2O2+shDKK3 + pcDNA3.1 and H2O2 +shDKK3 + pcDNA3.1-MFF. B. Cell viability was examined by CCK-8 assay kit. C. Cell apoptosis was assessed by flow cytometry. D. The protein expressions of Bax, Bcl2, Cleaved-caspase 3 and Caspase 3 in HK-2 cells were measured by Western blotting. E. Mitochondria ROS level was measured by mitoSOX assay kit. Scale bar, 100 μm and 20 μm. F. SOD was detected by the assay kit. G. MDA was detected by the assay kit. H. GPX was detected by the assay kit. I. Mitochondrial membrane potential was measured by the JC-1 detection kit. J. The protein expressions of Mfn2, MFF, Drp1, YME1L and NOX4 in HK-2 cells were measured by Western blotting. K. The protein expressions of α-SMA, Fibronectin, TGF-β and E-cadherin in HK-2 cells were measured by Western blotting. Data were expressed as mean ± SD. *p < 0.05, **p < 0.01 and ***p < 0.001.
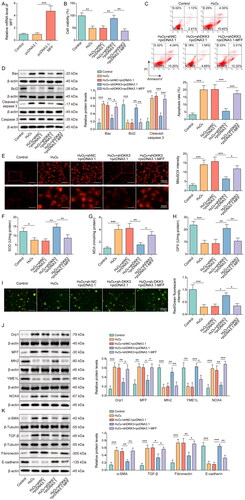
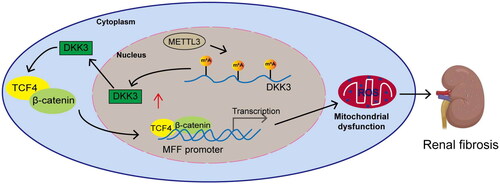
Figure 8. The molecular action schematic. METTL3 activates the DKK3-mediated TCF4/β-catenin signaling pathway by increasing the m6A modification on DKK3 and promotes the entry of TCF4 and β-catenin into the nucleus to increase MFF transcriptional expression, leading to mitochondrial dysfunction and oxidative stress, thereby causing renal fibrosis.