
Figures & data
Figure 1. Flow diagram showing the patient enrollment and follow-up.
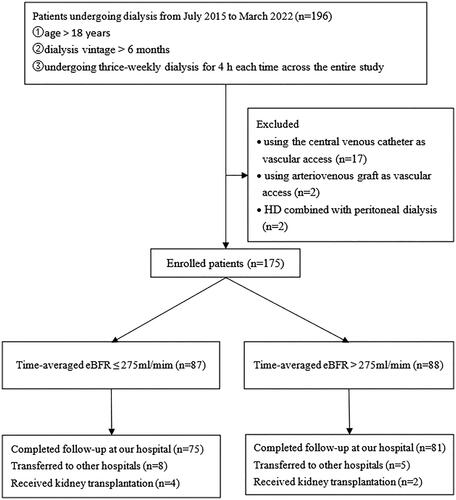
Figure 2. The distribution of time-averaged eBFR in enrolled patients.
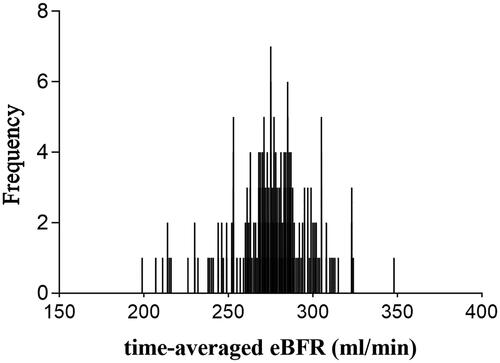
Table 1. Demographics and patient characteristics in two groups based on the time-averaged eBFR.
Table 2. The baseline and time-averaged values in two groups based on the time-averaged eBFR.
Figure 3. A. Unadjusted Kaplan–Meier curves for all-cause mortality in two groups based on time-averaged eBFR. B. Unadjusted Kaplan–Meier curves for new MACE in two groups based on time-averaged eBFR.
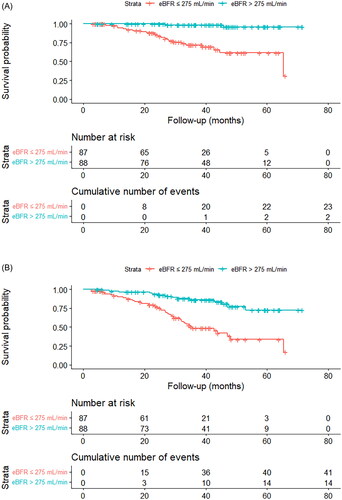
Table 3. The relationship between eBFR and clinical outcomes.
Table 4. The baseline characteristics and data in the two groups based on the time-averaged eBFR after propensity score matching.
Figure 4. A. Subgroup analyses for the relationship of eBFR and all-cause mortality in patients according to age, sex, BMI, diabetes, CVD, HDF ≥ 1/week, and ALB. BMI, body mass index; CVD, cardiovascular disease; HDF, hemodiafiltration; ALB, albumin; HR, hazard ratio; CI confidence interval. B. Subgroup analyses for the relationship of eBFR and new MACE in patients according to age, sex, BMI, diabetes, CVD, HDF ≥ 1/week, and ALB. BMI, body mass index; CVD, cardiovascular disease; HDF, hemodiafiltration; ALB, albumin; HR, hazard ratio; CI confidence interval.
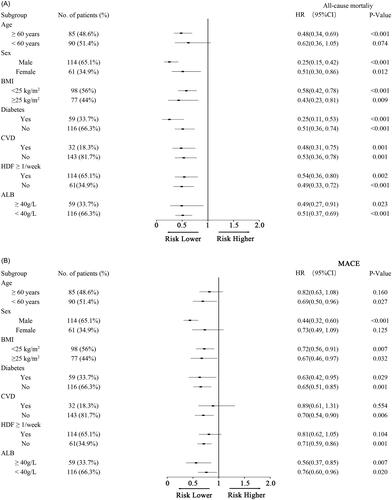
Table 5. The outcome of AVF in two groups based on the time-averaged eBFR.