
Figures & data
Figure 1. Serum BUN and Creatinine level in mice different groups.
*p < 0.05; **p < 0.01; ***p < 0.001 vs. Control negative group I.
#p < 0.05; ##p < 0.01; ###p < 0.001 vs. Control negative treated Gallic A. group II
¶p < 0.05; ¶¶p < 0.01; ¶¶¶p < 0.001 vs. Intoxicated NiO-NPs group III.
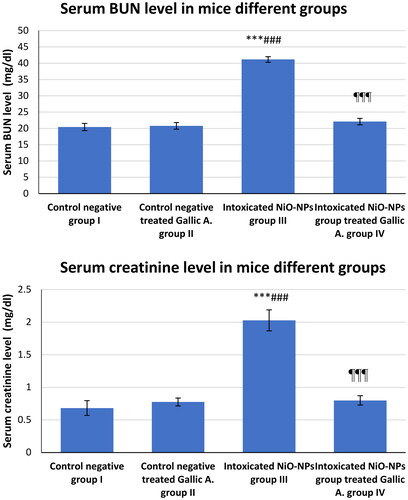
Table 1. SOD level (U/g), GST level (U/g), GSH-Px level (U/g), MDA (µM/g) in mice different groups.
Table 2. Renal tissue homogenate 8-OH-dG (ng/mg/protein), phospho-NF-κB (pg/ml), and PC (nmol/mg) levels in mice different groups.
Figure 2. Western blot assay of p65 protein levels in mice different groups.
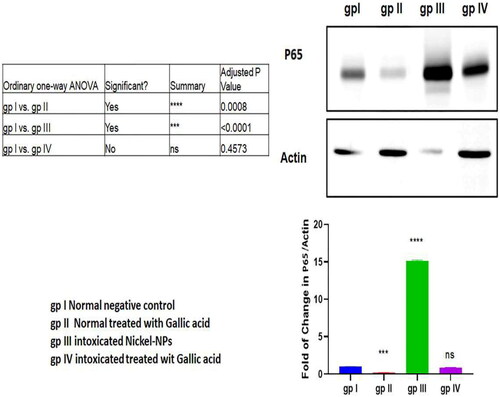
Figure 3. p65 immunohistochemical staining in the kidney of mice in the different groups. A) Control group and B) Mice treated by gallic acid alone showing minimal p65 reactivity in few cells for proximal tubules (arrow). C) Mice treated by NiO-NPs only showing high p65 immunoreactivity in podocytes, proximal and distal tubules cells (arrows). D) Mice treated by NiO-NPs and gallic acid showing minimal p65 immunoreactivity in the proximal tubules cells (arrows). Original magnification 200X, scale bar 50 µm.

Figure 4. Caspase-1 immunohistochemical staining in the kidney of mice in the different groups. A) Control group and B) Mice treated by gallic acid alone showing minimal Caspase- 1 reactivity in the proximal tubular cells (arrows). C) Mice treated by NiO-NPs only showing high Caspase-1 immunoreactivity in the proximal and distal tubular cells, and podocytes (arrow). D) Mice treated by NiO-NPs and gallic acid showing mild Caspase-1 immunoreactivity in the proximal and distal tubular cells (arrows). Original magnification 200X, scale bar 50 µm.
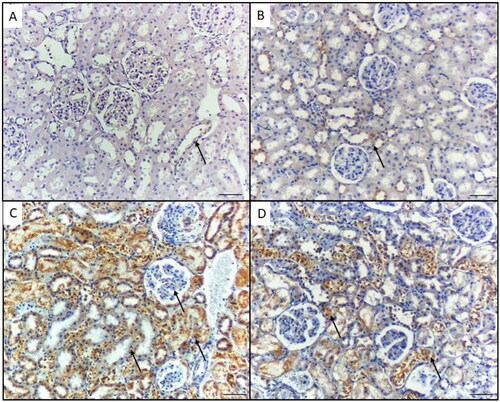
Table 3. The quantified comparison of immunohistochemical staining for P65 and caspase-1 in mice different groups.
Figure 5. Histopathological changes in the kidney of mice in the different groups. A) Control negative group showing normal features of the kidney; renal convoluted tubules (black arrows), and glomeruli (yellow star). B) Mice treated by gallic acid alone showing normal features of the kidney. C) Mice intoxicated by NiO-NPs only showing extensive renal damage features such as hyaline cast and loss of nuclei in the renal tubules (blue arrow), and shrunken or splitting glomeruli as evident by widened Bowman’s capsule (red star), shrinkage of glomeruli and widening of Bowman’s space (red star), inflammatory cells infiltration (blue arrow), and interstitial hemorrhage (green arrow). D) Mice intoxicated by NiO-NPs and treated gallic acid showing mild renal damage features such as; inflammatory cells infiltration (blue arrow), and interstitial hemorrhage (green arrow). Original magnification 200X, scale bar 50 µm.
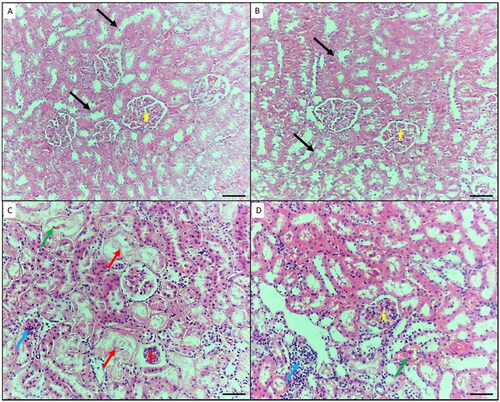
Table 4. The quantified comparison of histopathological parameters study in mice different groups.
Data availability statement
The data that support the findings of this study are available on request from the corresponding author, El-Refaei MF. The data are not publicly available for the time being and will be available on demand.