
Figures & data
Figure 1. HIF-1α activation induced by CoCl2 aggravated lipid accumulation in diabetic kidneys. (A) The protein expression of HIF-1α was detected by immunofluorescence staining (×400, marked by arrows) and (B and C) Western blotting (n = 5). Densitometry analysis of each protein band was performed using the software Image J, and normalized to β-actin. (D) TG, TC, LDL-C, and HDL-C levels in the serum were measured (n = 9-11). (E) Lipid accumulation in the kidneys of rats was quantified by the TG quantification assay (mean ± SD, n = 7). (F) Oil red O staining (×400) was performed to observe neutral lipid accumulation in kidneys. Data are presented as mean ± SD. *p < 0.05, **p < 0.01, ***p < 0.001, ****p < 0.001 versus Control; #p < 0.05, ##p < 0.01 versus DM.
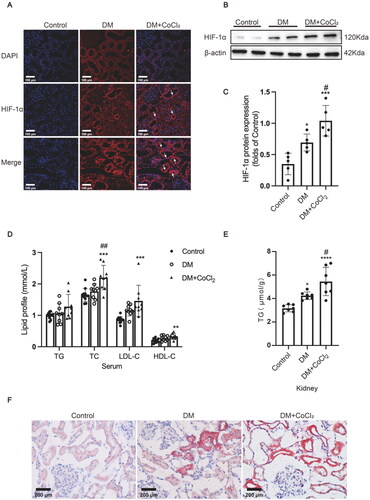
Figure 2. HIF-1α activation induced by CoCl2 exacerbated tubular injury in diabetic kidneys. (A) The serum blood glucose level (n = 8), (B) urinary albumin/creatinine ratio (n = 9-11), and (C) urinary NAG/creatinine ratio (n = 5-6) were measured. (D) Histological changes in the renal tubules were detected by PAS staining (×100); Renal tubules with increased apoptosis were marked by asterisk in HE staining (×200); Extracellular matrix deposition was detected by Masson staining (blue area, ×200). (E) The damaged area in PAS staining was calculated by the software Image-Pro Plus (n = 3-5). (F) The protein expression of TGF-β1 and CTGF was detected by immunohistochemical staining and (G and H, ×200) Western blotting (n = 4–8). Densitometry analysis of each protein band was performed using the software Image J, and normalized to β-actin. Data are presented as mean ± SD. *p < 0.05, **p < 0.01, ***p < 0.001, ****p < 0.0001 versus Control, #p < 0.05, ###p < 0.001 versus DM.
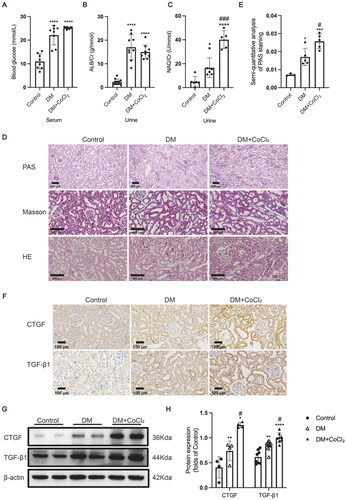
Figure 3. HIF-1α activation increased lipid accumulation and profibrogenic factor expression in HK-2 cells. (A) The protein expression of HIF-1α was detected by immunofluorescence staining (×800) and (B-C) Western blotting. (D) Lipid accumulation in HK-2 cells was measured by the TG quantification assay. (E) Oil red O staining (×400) was conducted to observe neutral lipid accumulation in HK-2 cells. (F) Quantification of cellular lipids stained by oil red O using software image J. (G-H) The protein expression of HIF-1α was detected by Western blotting. (I) TG quantification assay. Densitometry analysis of each protein band was performed using the software Image J, and normalized to β-actin. Data are presented as mean ± SD. *p < 0.05, **p < 0.01, ***p < 0.001 versus Control. $p < 0.05, $$p < 0.01 versus HG. #p < 0.05, ##p < 0.01 versus NC.
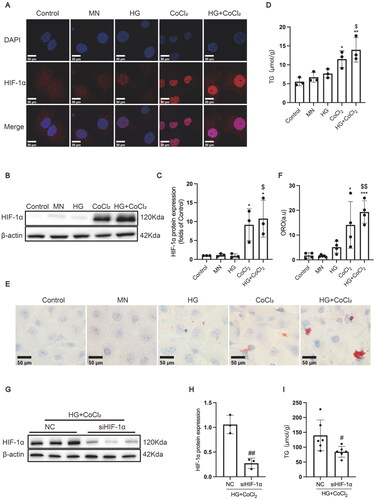
Figure 4. HIF-1α inhibition by YC-1 treatment decreased lipid accumulation in diabetic kidneys. (A) The protein expression of HIF-1α was detected by immunofluorescence staining (×400, marked by arrows) and (B-C) Western blotting (n = 3). Densitometry analysis of each protein band was performed using the software Image J, and normalized to β-actin. (D) TG, TC, LDL-C, and HDL-C levels in the serum were measured (n = 5-6). (E) Lipid accumulation in the kidneys of rats was quantified by the TG quantification assay, (n = 5). (F) Oil red O staining (×400) was conducted to observe neutral lipid accumulation in kidneys. Data are presented as mean ± SD. *p < 0.05, **p < 0.01 versus DM + DMSO.
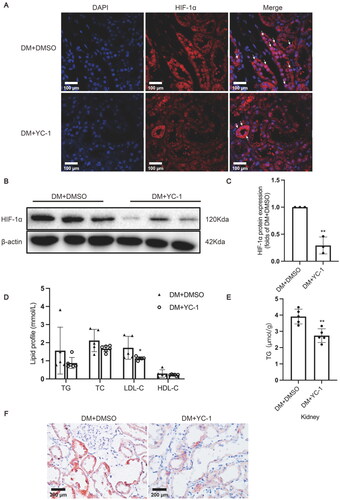
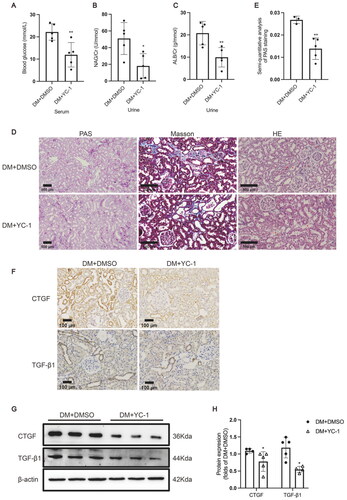
Figure 5. HIF-1α inhibition by YC-1 treatment alleviated tubular injury in diabetic kidneys. (A) The serum blood glucose level (n = 5), (B) urinary albumin/creatinine ratio (n = 5), and (C) urinary NAG/creatinine ratio (n = 5) were measured. (D) Histological changes in the renal tubules were detected by PAS staining (×100); Renal tubules with increased apoptosis were marked by asterisk in HE staining (×200); Extracellular matrix deposition was detected by Masson staining (blue area, ×200). (E) The damaged area in PAS staining was calculated by the software Image-Pro Plus (n = 3-5). (F) The protein expression of TGF-β1 and CTGF was detected by immunohistochemical staining (×200) and (G and H) Western blotting (n = 5). Densitometry analysis of each protein band was performed using the software Image J, and normalized to β-actin. Data are presented as mean ± SD. *p < 0.05, **p < 0.01 versus DM + DMSO.
Data availability statement
All data used and analyzed during this study will be available from the corresponding author upon reasonable request.