
Figures & data
Figure 1. Flow chart.
Abbreviations: AKI, acute kidney injury; CRS, cardiorenal syndrome; ESKD, end-stage kidney disease; KRT, kidney replacement therapy.
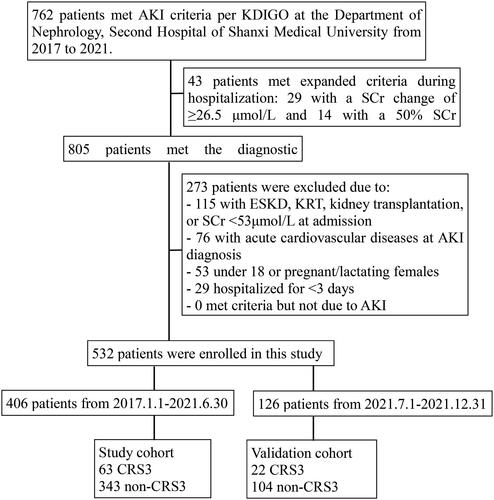
Table 1. Distribution of acute cardiovascular events.
Table 2. Characteristics of patients in the study and validation cohorts.
Figure 2. Independent risk factors of CRS type 3 occurrence among AKI patients.
Abbreviations: AKI, acute kidney injury; CRS cardiorenal syndrome; CVD, :cardiovascular disease; MAP: mean artery pressure.
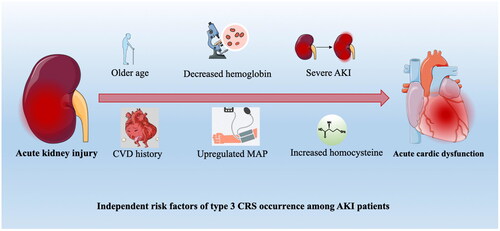
Table 3. Multivariate logistic analysis of the study cohort.
Figure 3. Risk nomogram conducted by logistic regression.
Abbreviations: CVD: cardiovascular disease; MAP:mean artery pressure; AKI: acute kidney injury
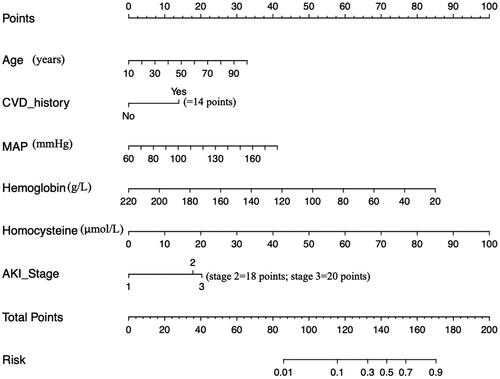
Figure 4. Examples of the nomogram in clinical practice.
Figures illustrate the process of calculating the risk scores of CRS3 and non-CRS3 using the nomogram. (A) A 60-year-old patient with MAP level of 160 mmHg, hemoglobin level of 90g/L, and homocysteine level of 50 μmol/L at admission, which corresponds to a risk between 0.7 to 0.9 (70%-90%). (B) A 30-year-old patient with AKI stage 3, CVD history, MAP level of 140mmHg, and homocysteine level of 35 μmol/L at admission, which corresponds to an CRS3 risk of less than 0.1 (<10%).
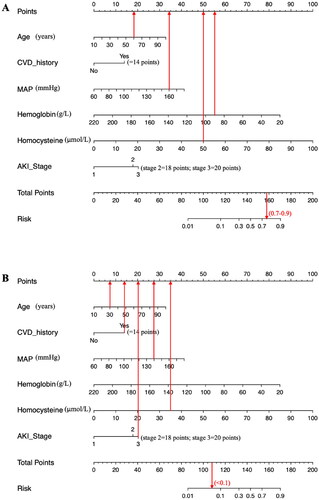
Figure 5. Receiver operating characteristic curves of the nomogram in the study cohort (A) and the validation cohort (B).
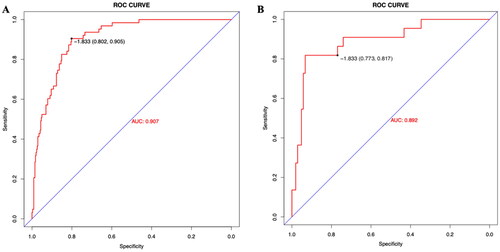
Figure 6. The calibration curve and results of the DCA of the nomogram in the validation cohort.
(A) Calibration curves represent the difference between the actual prediction and the ideal perfect prediction (45° line). (B) The DCA curve of the nomogram for predicting CRS type 3. It revealed that the nomogram could obtain a greater net benefit than either the ‘treat all’ or the ‘treat none’ strategy
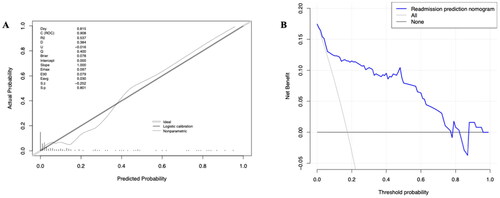
Table 4. Prediction model accuracy in the validation cohort.