
Figures & data
Figure 1. Nsun5 knockout mice resulted in a significant reduction in survival.
(A) Strategy for generating Nsun5 deficiency mice involved selecting exon 3–4 of Nsun5 for mutation, and using Cas9 or gRNA to transfer mutations from exogenous donor DNA into the recipient chromosomes by nonhomologous recombination at the target site. (B) The pooled system of single-cell embryo microinjection was utilized to generate founder mice. (C) Homozygote Nsun5 deficiency mice were directly sequenced and the results were obtained. (D) The weight of PD21 individual pups was observed to be reduced in Nsun5-/- mice compared to WT mice. For each genotype, n = 6. (E) The survival of Nsun5-/- mice was measured. For each genotype, n = 48. The data, represented as mean ± SEM analyzed using the Student’s t-test, *p < 0.05, **p < 0.01.
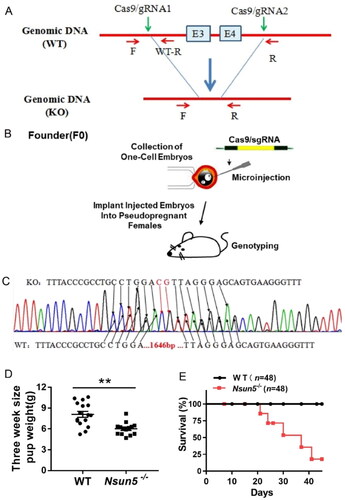
Figure 2. Nsun5-/- mice suffered multiple organ damages.
(A–D) Representative photos of the kidney (A), lung (B), liver (C), and heart (D) sizes at PD21 pups are shown. (E–H) The weight of kidney (E), lung (F), liver (G), and heart (H) in PD21 pups were reduced in Nsun5-/- mice compared to WT mice. (I–L) There were no significant difference in kidney body ratios (I), lung body ratios (J), liver body ratios (K), and heart body ratios (L) of PD21 pups. For each genotype, n = 5–7. The data presented are the mean ± SEM and were analyzed using the Student’s t-test, *p < 0.05, **p < 0.01.
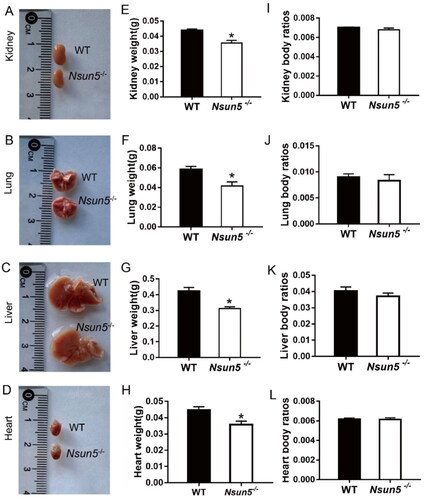
Figure 3. Analysis of kidney and lung tissue in Nsun5-/- mice.
(A) Representative images of H&E-stained kidney sections of Nsun5-/- and WT mice at postnatal day (PD) 15 showed normal morphology. (B) Representative images of H&E-stained kidney sections of Nsun5-/- and WT mice at PD 25 exhibited glomerular degeneration (red arrows). Scale bars: 50μm. (C) Representative images of H&E-stained lung sections of Nsun5-/- and WT mice at PD 15 showed normal tissue structure. (D) Representative images of H&E-stained lung sections of Nsun5-/- and WT mice at PD 25 displayed incrassated thickening of alveolar walls (red stars). Scale bars: 100μm.
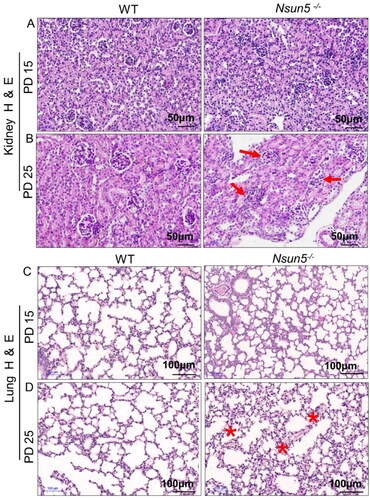
Figure 4. Kidney analysis of Nsun5-/- mice.
(A) Representative images of kidney sections stained with periodic acid-Schiff (PAS) from Nsun5-/- and WT mice at PD 25 show significant glomerular glycogen deposition (red arrows). Scale bars: 20μm. (B) Representative images of kidney sections stained with Sirius red from Nsun5-/- and WT mice at PD 25 show significant glomerular collagen fiber hyperplasia (red arrows). Scale bars: 20μm. (C–D) Under electron microscopy, shortened podocyte foot processes (red arrows) can be observed in Nsun5-/- mice compared to WT mice at PD 25. The magnifications in (C) and (D) are 5000 × and 10,000×, respectively.
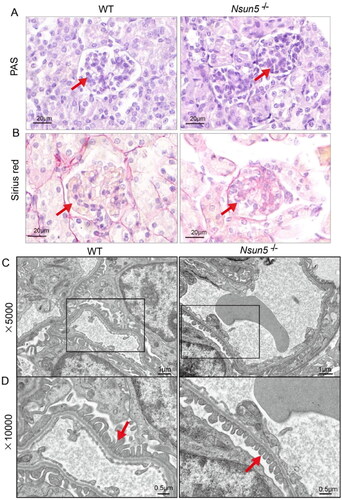
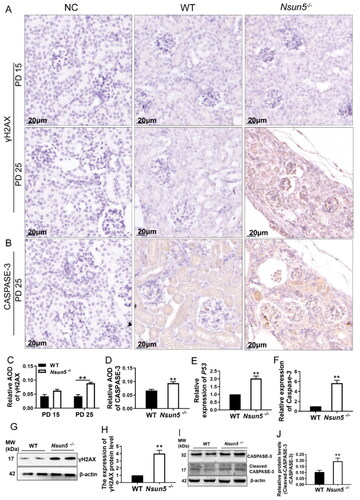
Figure 5. Nsun5-/- mice exhibited high expression of apoptosis signal and DNA damage in the kidneys.
(A) Immunohistochemistry showed that the staining intensity of the γH2AX positive cells is increased in the kidney Nsun5-/- mice compared to WT at PD 25 not PD 15. Scale bar: 20μm. (B) Immunohistochemistry showed that the staining intensity of the CASPASE-3 positive signal is increased in the kidney of Nsun5-/- mice compared to WT at PD 25. (C-D) Average optical density (AOD) was used for the quantitative analysis of immunohistochemistry staining, and the data are shown in bar graphs. (E-F) The mRNA expression levels of P53 (E) and Caspase-3 (F) in the kidney of Nsun5-/- mice were higher than those in WT mice (n = 6-8 per genotype). (G) Results of Western blotting showed that the protein level of γH2AX was increased in the kidney Nsun5-/- mice compared to those in WT. (H) The results of Western blotting were quantified and displayed in bar graphs. The values are given as mean ± SEM analyzed using Student’s t-test. * P < 0.05, ** P < 0.01 (I) Results of Western blotting showed that the protein level of CASPASE-3 was increased in the kidney of Nsun5-/- mice compared to those in WT. (J) The results of Western blotting were quantified and displayed in bar graphs. The values are given as mean ± SEM analyzed using Student’s t-test. * p < 0.05, ** p < 0.01.
Data availability statement
This manuscript contains all of the data produced during this research.