Figures & data
Figure 1. Establishment of PD-induced peritoneal fibrosis in vivo. Rats were euthanized on days 0, 7, 14, and 28, and peritoneal tissues were collected. (A) The parietal peritoneal tissues were assessed by H&E and Masson’s staining. Magnification, ×400. (B) The bar graphs represent the thickness of the peritoneum and Masson-positive areas at different time points. Data were expressed as the mean ± SD. ns, no significance, *p < 0.05, ***p < 0.001.
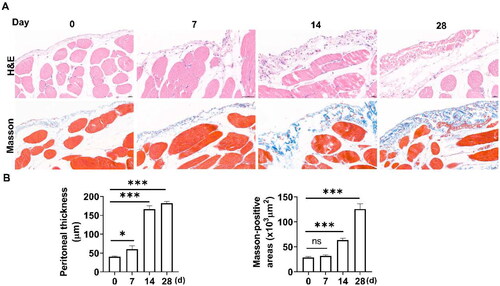
Figure 2. CAPE alleviates PD-induced peritoneal fibrosis. (A) The structural changes of the rat peritoneum in different groups were observed using H&E and Masson’s staining. Magnification, ×400. (B) The bar graphs represent the thickness of the peritoneum and Masson-positive areas. (C) Immunohistochemical staining of CD31 in the rat peritoneum of different groups. Magnification, ×400. (D) The bar graph represents CD31-positive vessels in peritoneum. (E) The results of the peritoneal equilibration test. Data were expressed as the mean ± SD. ns, no significance, **p < 0.01, ***p < 0.001.
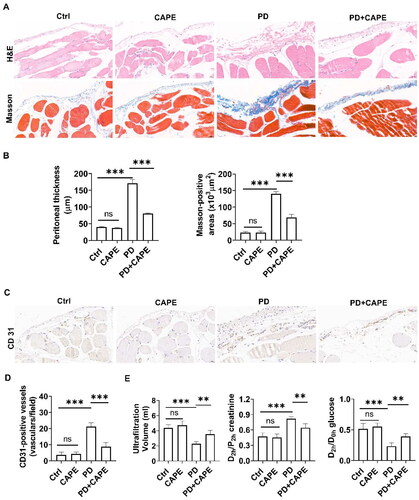
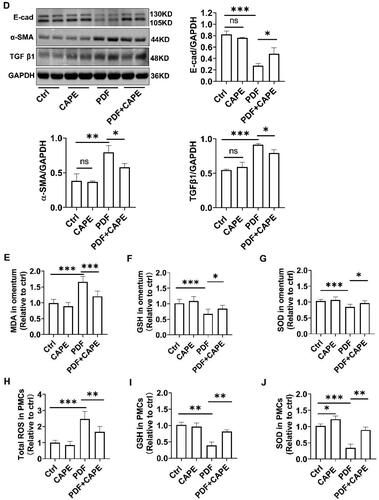
Figure 4. CAPE rescues mitochondrial homeostasis in the PD state. (A) Confocal microscopic images revealed increased mitochondrial ROS in PDF-induced PMCs, which was significantly reversed by CAPE. Magnification, ×200. (B) Transmission electron microscopy images of mitochondria in PMCs, with a scale bar of 500 nm, indicate the disappearance of mitochondrial cristae (arrow) and mitochondrial swelling and cristae reduction (star). (C) ATP levels in PMCs in the indicated groups. (D) ATP levels in the omentum. *p < 0.05, **p < 0.01, ***p < 0.001.
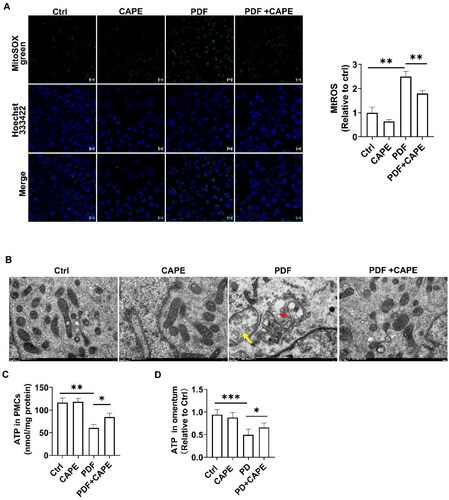
Figure 5. CAPE activates the AMPK/SIRT1 pathway in PDF-treated PMCs. (A) Immunoblotting results showed that exposure of PMCs to PDF for 12 h resulted in a decrease in AMPK phosphorylation and SIRT1 expression. CAPE reversed the decrease in AMPK phosphorylation but SIRT1 expression. (B) PMCs exposed to PDF for 24 h still significantly inhibited AMPK phosphorylation and SIRT1 expression. At this point, CAPE reversed the decrease in AMPK phosphorylation and the downregulation of SIRT1 in PDF-treated PMCs. *p < 0.05, **p < 0.01, ***p < 0.001.
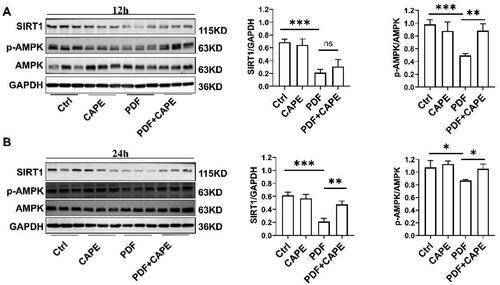
Figure 6. CAPE maintains mitochondrial homeostasis via the AMPK/SIRT1 pathway. The beneficial effects of CAPE on restoring MMP (A) and reducing mitochondrial ROS (B) were neutralized by Compound C or the SIRT1 knockdown. Magnification, ×400. (C) The beneficial effect of CAPE on inhibiting total intracellular ROS depended on AMPK and SIRT1. (D) GSH levels in PMCs in the indicated groups. (E) GSH levels in PMCs in the indicated groups. (F) ATP levels in PMCs in the indicated groups. (G) The protein levels of E-cadherin, α-SMA, and TGF β1 in PMCs from different groups were detected. *p < 0.05, **p < 0.01, ***p < 0.001.
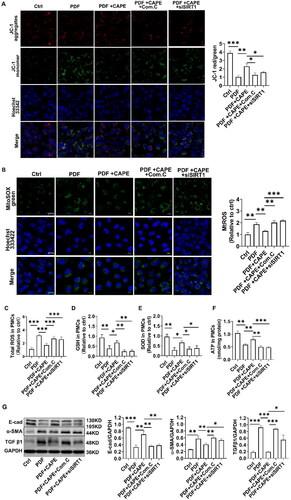
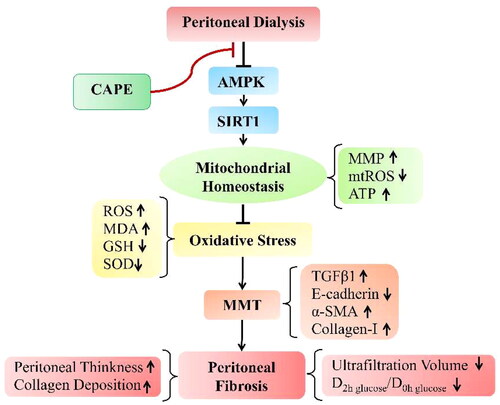
Figure 7. Schematic diagram depicting the possible molecular mechanisms by which CAPE prevents peritoneal fibrosis by maintaining mitochondrial integrity under PD conditions. Under PD conditions, AMPK/SIRT1 pathway are downregulated, which disturbs mitochondrial homeostasis and then leads to oxidative stress. This upregulated oxidative stress results in MMT, which eventually leads to peritoneal fibrosis. Interestingly, CAPE treatment activates the AMPK/SIRT1 pathway and restores mitochondrial homeostasis, which alleviating oxidative stress, thereby attenuating PD-induced MMT and peritoneal fibrosis.