Figures & data
Figure 1. Trametinib, a MEK inhibitor, prolongs survival time in a JMML PDX mouse model compared to control. (A) A simplified schematic of the RAS pathway demonstrating the mutations identified in the patient in this case (PTPN11 and NF1, highlighted with red borders) and the mechanism of action of trametinib, a MEK inhibitor (highlighted with red borders) which acts by downregulation of ERK phosphorylation. (B) Kaplan-Meier survival curve for JMML PDX mice treated with trametinib versus vehicle control. The duration of trametinib treatment in the experiment (28 days) is denoted by the box labeled ‘tx’. The trametinib treatment group showed a statistically significant increase in median survival compared to control.
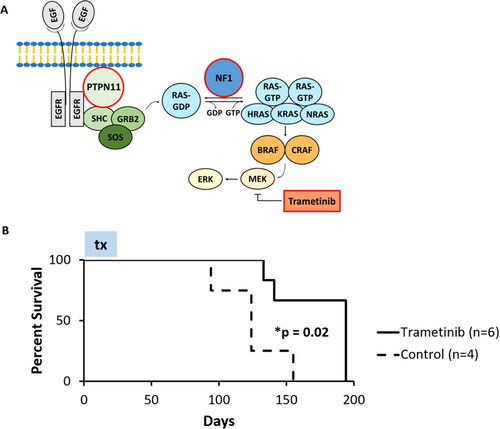
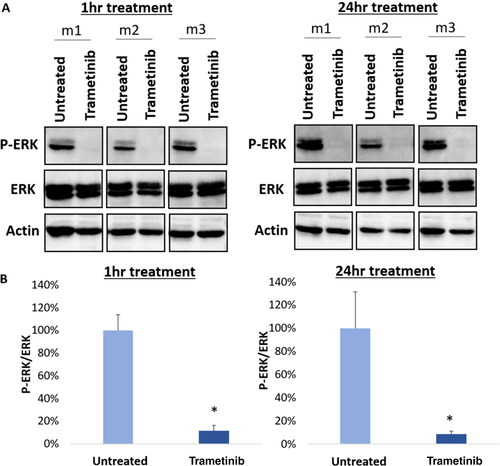
Figure 2. Trametinib downregulates p-ERK in JMML PDX cells. (A) Immunoblotting was performed in cells after 1 h (left, n = 3) and 24 h (right, n = 3) of treatment with trametinib at 200 nM. The control group was untreated cells. A representative blot is depicted. (B) Digital quantification of the bands is shown. Trametinib significantly decreases p-ERK expression relative to total ERK compared to untreated cells (1 h p < 0.001, n = 3; 24 h p = 0.007, n = 3), confirming its mechanism of MEK inhibition. The student’s t-test was used and the error bars depict standard deviation.