Figures & data
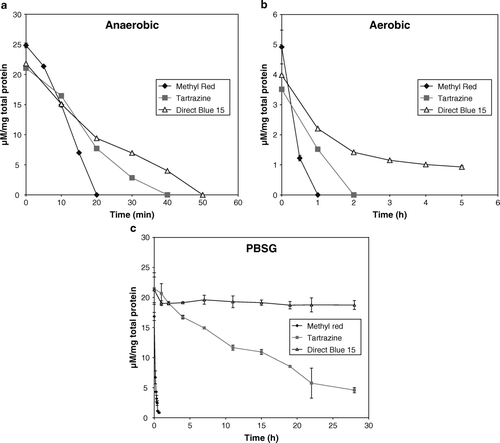
Figure 1. Reduction of Direct Blue 15, Methyl Red, and tartrazine by E. faecalis whole cells. The units on the y-axis are expressed as dye concentration (µM) per milligram of total protein. (a) Anaerobic reduction. The 10 ml culture inoculated with mid-log phase cells was incubated without shaking at 37°C. (b) Aerobic reduction. The 500 ml flasks containing 50 ml culture were incubated at 37°C and 200 rpm. Due to the high biomass, the ratio of dye concentration to amount to total protein on the y-axis is lower compared with the anaerobic assay. (c) PBSG medium (prolonged lag phase/growth-arrest). The 10 ml culture inoculated with mid-log phase cells (washed in PBSG buffer) was incubated without shaking at 37°C. The controls contained dye only in BHIS or PBSG. Each data point is the mean of triplicates.

Table I. Kinetics of azo dye reduction by E. faecalis whole cells and cell extract.
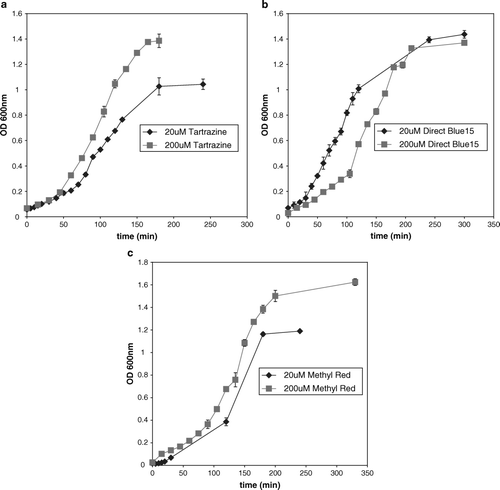
Figure 2. The effect of azo dyes on the growth of E. faecalis. (a) Tartrazine, 20 µM and 200 µM. (b) Direct Blue 15, 20 µM, and 200 µM. (c) Methyl Red, 20 µM and 200 µM. The data are a mean of triplicates.

Table II. Generation time of E. faecalis in the presence of various azo dyes.
Figure 3. Structure of Methyl Red, Direct Blue 15 and tartrazine Citation[5].
![Figure 3. Structure of Methyl Red, Direct Blue 15 and tartrazine Citation[5].](/cms/asset/e8502af1-8747-43da-b888-4998a161163a/zmeh_a_317129_f0003_b.gif)