
Figures & data
Table 1. The primer sequence of RT-PCR.
Figure 1. Dex at different concentrations inhibited the expression of KLF2 in GPCs. The isolated GPCs were treated with dexamethasone (Dex, 0, 10, 50, 100 μM) for 72 h. (A) The cell viability of rat GPCs treated with different doses of Dex. (B) The mRNA expression of KLF2 in chondrocytes after treated with different doses of Dex. (C) The protein expression of KLF2 in chondrocytes after treated with different doses of Dex. “*” means compared with 0 μM group p < 0.05. GAPDH was used as an invariant internal control for calculating protein-fold changes.
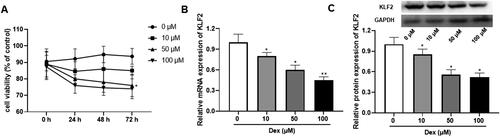
Figure 2. Overexpression of KLF2 promotes proliferation of Dex-induced GPCs. GPCs were transfected with pcDNA3.1-KLF2 or control pcDNA3.1, and then treated with Dex (50 μM) for 24 h. (A) The protein expression of KLF2 was detected by Western blot. (B) Cell viability of chondrocytes was detected by CCK-8 assay. (C) Cell cycle analysis of chondrocytes treated with Dex was quantified by PI staining and fluorescence flow cytometry. (D–E) The protein expression of Ki-67 was detected by Western blot. “*” means compared with control group p < 0.05, and “#” means compared with Dex + pcDNA3.1 group p < 0.05. GAPDH was used as an invariant internal control for calculating protein-fold changes.
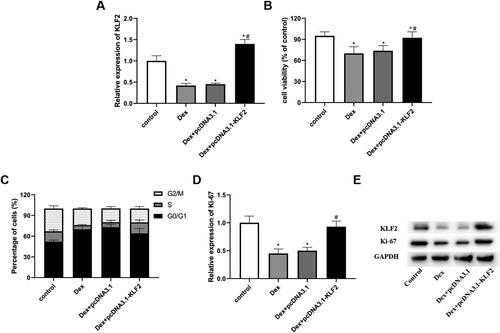
Figure 3. Overexpression of KLF2 inhibits Dex-induced apoptosis of GPCs. GPCs were transfected with pcDNA3.1-KLF2 or control pcDNA3.1, and then treated with Dex (50 μM) for 24 h. (A) The apoptosis rate of Dex-induced chondrocytes was measured by fluorescence flow cytometry. (B) The protein expression of c-caspase-3, Bax and Bcl-2 was detected by Western blot. “*” means compared with control group p < 0.05, and “#” means compared with Dex + pcDNA3.1 group p < 0.05. GAPDH was used as an invariant internal control for calculating protein-fold changes.
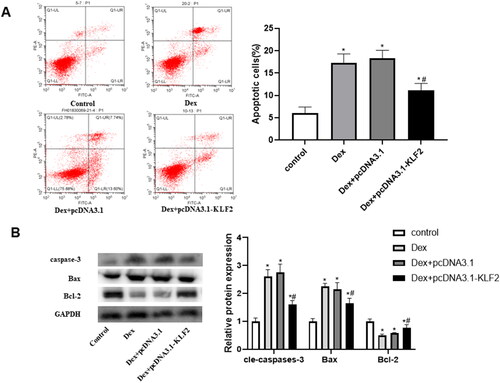
Figure 4. Overexpression of KLF2 inhibits Runx2 mediated activation of PI3K/AKT and ERK signalling pathways. GPCs were transfected with pcDNA3.1-KLF2 or control pcDNA3.1, and then treated with Dex (50 μM) for 24 h. (A) The protein expression of Runx2, PI3K, AKT and ERK was detected by Western blot. (B) Quantification of protein expression of Runx2, PI3K, AKT and ERK. “*” means compared with control group p < 0.05, and “#” means compared with Dex + pcDNA3.1 group p < 0.05. GAPDH was used as an invariant internal control for calculating protein-fold changes.
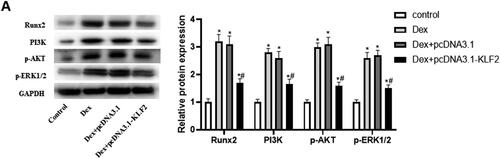
Figure 5. Runx2-mediated PI3K/AKT and ERK signalling pathways are involved in KLF2 regulation of GPCs. After GPCs were transfected with pcDNA3.1-KLF2 or PI3K agonist (740Y-P) or pcDNA3.1-ERK, GPCS were treated with Dex (50 μM) for 24 h. (A) The protein expression of Runx2, PI3K, AKT and ERK was detected by Western blot. (B) Cell viability of chondrocytes was detected by CCK-8 assay. (C) The apoptosis rate of Dex-induced chondrocytes was measured by fluorescence flow cytometry. (D) The protein expression of c-caspase-3 was detected by Western blot. “*” means compared with control group p < 0.05, and “#” means compared with pcDNA3.1-KLF2 group p < 0.05. GAPDH was used as an invariant internal control for calculating protein-fold changes.
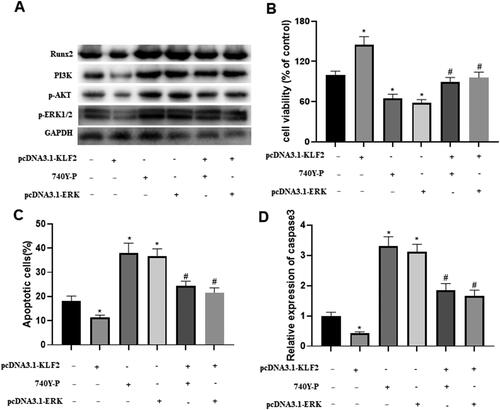
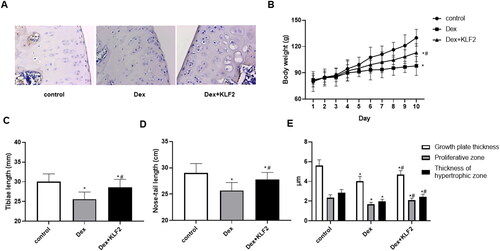
Figure 6. Overexpression of KLF2 alleviates growth retardation in rats. SD rats were injected with Dex intraperitoneally and KLF2 overexpression vector in the joint, and were divided into three groups: control, Dex, Dex + KLF2. (A) Immunohistochemistry was used to analyse the expression of KLF2 in rat tibiae growth plate. (B-D) Quantification of the rat body weight, length of tibiae and nose-tail. (E) Quantification of the thickness of growth plate, proliferative zone and hypertrophic zone. “*” means compared with control group p < 0.05, and “#” means compared with Dex group p < 0.05.
Data availability statement
The datasets used and/or analysed during the current study are available from the corresponding author on reasonable request.