
Figures & data
Figure 1. Quercetin inhibits OVA-induced nasal symptoms of AR. The AR mice model was established and quercetin (20, 35, and 50 mg/kg) was given oral, nasal allergic symptoms including (A) rubbing and (B) sneezing were quantified. **p < 0.01. *p < 0.05.
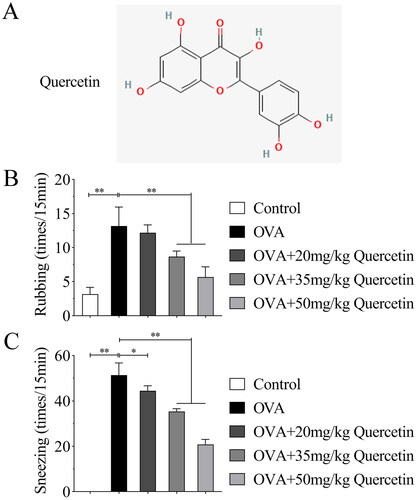
Figure 2. Quercetin promotes Th1/Th2 balance in the serum of OVA-induced mice. The serum of mice was collected, and (A) IgE, (B) IgG1, (C) IgG2a, (E) histamine, (F) IFN-γ, (G) IL-4, and (H) IL-5 levels were measured. (D) The ratio of IgG2a/IgG1 was quantified. **p < 0.01.
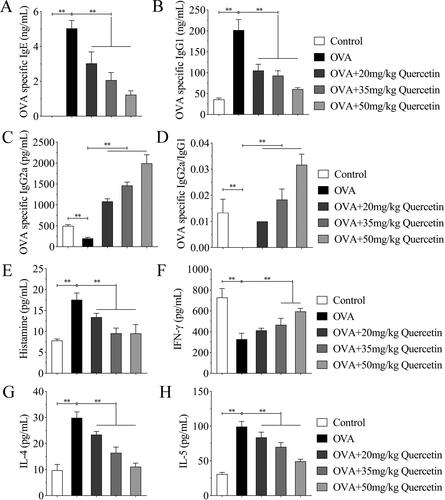
Figure 3. Quercetin inhibits differentiated inflammatory cells in NALF. (A) The differentiated inflammation-related cells were observed under a microscope using the diff-quick staining assay. (B) Total differentiated cells in NALF were quantified. (C) Each type of differential cells was quantified. (D) The ratios of differentiated cells/total cells were quantified. **p < 0.01. *p < 0.05.
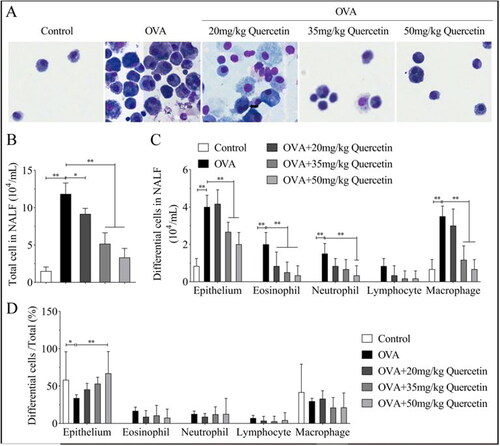
Figure 4. Quercetin inhibits inflammatory infiltration, goblet cells, and eosinophils induced by OVA. The nasal mucosa tissues of mice in each group were collected. (A) Pathological changes of mouse nasal mucosa were visualized using H&E staining assay. (B) The goblet cells were visualized using PAS staining. (C) The eosinophils were visualized using Giemsa staining. (D) The quantification of nasal thickness. (E) The quantification of PAS + cells. (F) The quantification of eosinophilic cells. **p < 0.01. *p < 0.05.
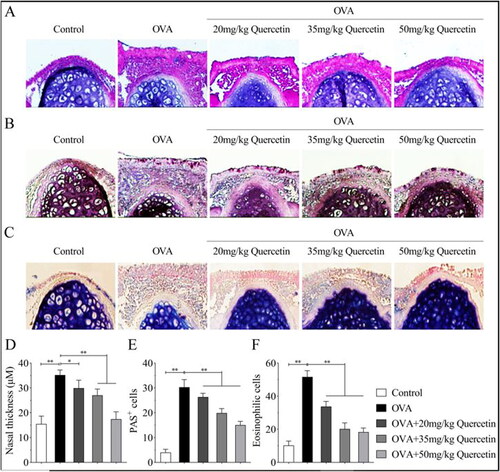
Figure 5. Quercetin inhibits inflammation response in NALF. qPCR was conducted to measure the mRNA expression of (A) IL-6 and (B) TNF-α. ELISA assessed the levels of (C) IL-6 and (D) TNF-α. **p < 0.01. *p < 0.05.
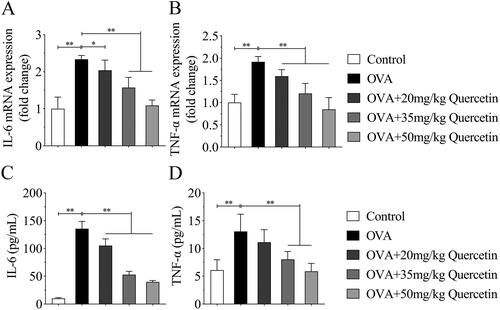
Figure 6. Quercetin promotes the balance of Treg/Th17 cells in NALF. (A) The percentage of Th17 (CD4 + IL-17+) cells and Treg (CD4+ Foxp3+) cells were measured by flow cytometry and quantified in (B) and (C). The mRNA expression of (D) RORγt and (E) Foxp3 was evaluated by qPCR. The levels of (F) IL-17, (G) TGF-β, (H) IL-10 and (I) Foxp3 were measured using ELISA kits. **p < 0.01. *p < 0.05.
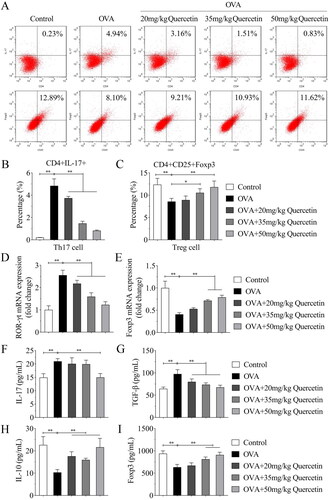
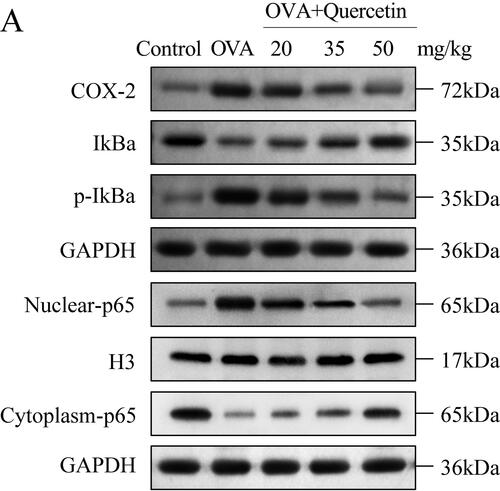
Figure 7. Quercetin inhibits OVA-induced activation the NF-κB pathway. The protein levels of the NF-κB pathway including COX-2, IkBα, p-IkBα, nuclear-p65, cytoplasm-p65 were measured using western blot. GAPDH was the internal control. H3 was the internal control of nuclear-p65.
Data availability statement
The datasets used and analyzed during the current study are available from the corresponding author on reasonable request.