
Figures & data
Table 1. LncRNA OIP5-AS1 siRNA sequences.
Table 2. qRT-PCR primers.
Figure 1. Identification of FLSs. (A) The primary and subcultured synovial cells were observed under a light microscope (a: The primary cells, ×400; b: The third generation of cells, ×200). (B) Synovial cells labelled with vimentin antibody under a fluorescence microscope (×200).
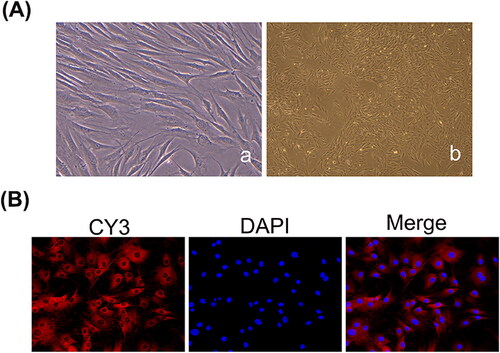
Figure 2. LncRNA OIP5-AS1 knockdown inhibits FLS proliferation. (A) Detection of transfection efficiency of lncRNA OIP5-AS1 siRNAs in FLSs from AA rats by qRT-PCR. (B) Inhibitory effect of lncRNA OIP5-AS1 siRNA on the proliferation of FLSs from AA rats at different times. ##P<0.01 compared to the normal group; *P<0.05 and **P<0.01 compared to the model group. Model: FLSs from AA rats; siRNAs 1, 2 and 3: different lncRNA OIP5-AS1 siRNA sequences; NC: negative control; and siRNA2 + NC: negative control of siRNA2.
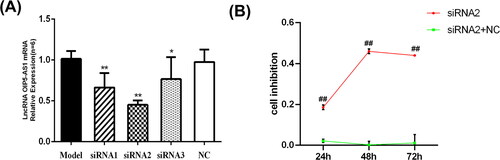
Figure 3. LncRNA OIP5-AS1 is localised in the cytoplasm according to the FISH assay.
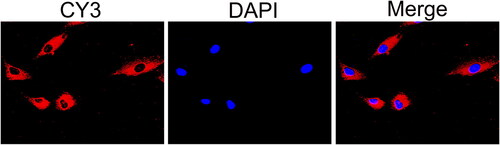
Figure 4. LncRNA OIP5-AS1 siRNA inhibits the expression of IL-1β(A),IL-6(B) and TNF-α(C) in FLSs serum. ##P<0.01 compared to the normal group; *P<0.05 and **P<0.01 compared to the model group. Normal: normal synovial cells; Model: FLSs from AA rats; OIP5-AS1 siRNA: lncRNA OIP5-AS1 siRNA2; OIP5-AS1 siRNA + NC: Negative control for siRNA.
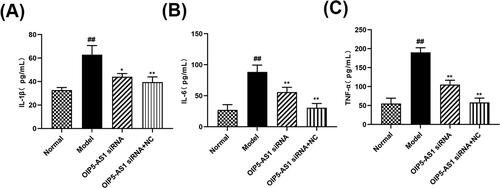
Figure 5. Effects of lncRNA OIP5-AS1 knockdown on the expression of lncRNA OIP5-AS1 and miR-410-3p in FLSs from AA rats. (A) The effects of lncRNA OIP5-AS1 expression after siRNA. (B) The effects of miR-410-3p expression after siRNA. ##P<0.01 compared to the normal group; *P<0.05 and **P<0.01 compared to the model group. Normal: normal synovial cells; Model: FLSs from AA rats; OIP5-AS1 siRNA: lncRNA OIP5-AS1 siRNA2; OIP5-AS1 siRNA + NC: Negative control for siRNA.
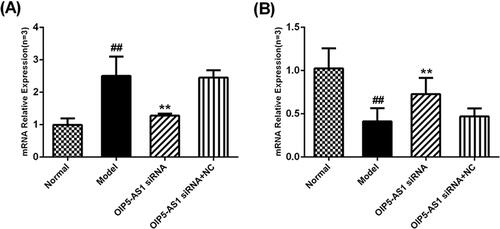
Figure 6. Changes of Wnt7b protein and mRNA expression levels in FLSs from AA rats after lncRNA OIP5-AS1 siRNA. (A) The change of Wnt7b protein expression was observed by immunofluorescence (×200;a: normal group; b model group; c: lncRNA OIP5-AS1 siRNA group; and d lncRNA OIP5-AS1 siRNA + NC group). (B) The change of Wnt7b mRNA expression was evaluated by qRT-PCR. (C) The change of Wnt7b protein expression was evaluated by Western blot analysis. (D) Semiquantitative analysis of Wnt7b protein. ##P<0.01 compared to the normal group; *P<0.05 and **P<0.01 compared to the model group. Normal: normal synovial cells; Model: FLSs from AA rats; OIP5-AS1 siRNA: lncRNA OIP5-AS1 siRNA2; OIP5-AS1 siRNA + NC: negative control for siRNA.
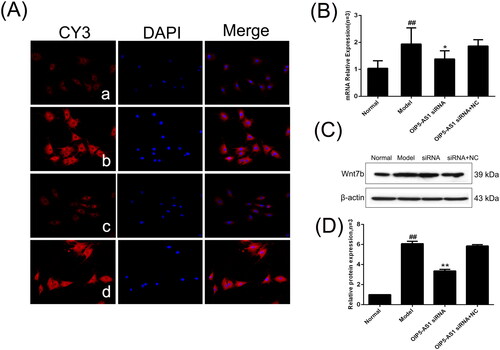
Figure 7. The changes of β-catenin protein and mRNA expression levels in FLSs from AA rats after lncRNA OIP5-AS1 siRNA. (A) The change of β-catenin protein expression was observed by immunofluorescence (×200; a: normal group; b: model group; c: lncRNA OIP5-AS1 siRNA group; and d: lncRNA OIP5-AS1 siRNA + NC group). (B) The change of β-catenin mRNA expression was evaluated by qRT-PCR. (C) The change of β-catenin protein expression was evaluated by Western blot analysis. (D) Semiquantitative analysis of β-catenin protein. ##P<0.01 compared to the normal group; *P<0.05 and **P<0.01 compared to the model group. Normal: normal synovial cells; Model: FLSs from AA rats; OIP5-AS1 siRNA: lncRNA OIP5-AS1 siRNA2; OIP5-AS1 siRNA + NC: negative control for siRNA.
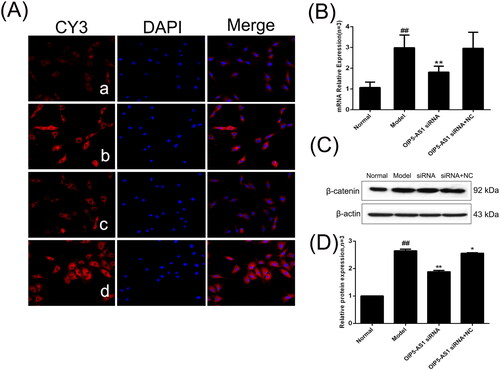
Figure 8. The changes of c-Myc protein and mRNA expression in FLSs from AA rats after lncRNA OIP5-AS1 siRNA. (A) The change of c-Myc protein expression was observed by immunofluorescence (×200; a: normal group; b: model group; c: lncRNA OIP5-AS1 siRNA group; and d: lncRNA OIP5-AS1 siRNA + NC group). (B) The change of c-Myc mRNA expression was evaluated by qRT-PCR. (C) The change of c-Myc protein expression was evaluated by Western blot analysis. (D) Semiquantitative analysis of c-Myc protein. ##P<0.01 compared to the normal group; *P<0.05 and **P<0.01 compared to the model group. Normal: normal synovial cells; Model: FLSs from AA rats; OIP5-AS1 siRNA: lncRNA OIP5-AS1 siRNA2; OIP5-AS1 siRNA + NC: negative control for siRNA.
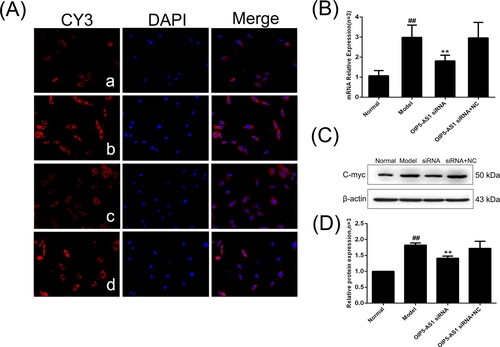
Figure 9. The changes of cyclin D1 protein and mRNA expression in FLSs from AA rats after lncRNA OIP5-AS1 siRNA. (A) The change of cyclin D1 protein expression was observed by immunofluorescence (×200; a: normal group; b: model group; c: lncRNA OIP5-AS1 siRNA group; and d: lncRNA OIP5-AS1 siRNA + NC group). (B) The change of cyclin D1 mRNA expression was evaluated by qRT-PCR. (C) The change of cyclin D1 protein expression was analysed by Western Blot analysis. (D) Semiquantitative analysis of cyclin D1 protein. ##P<0.01 compared to the normal group; *P<0.05 and **P<0.01 compared to the model group. Normal: normal synovial cells; Model: FLSs from AA rats; OIP5-AS1 siRNA: lncRNA OIP5-AS1 siRNA2; OIP5-AS1 siRNA + NC: negative control for siRNA.
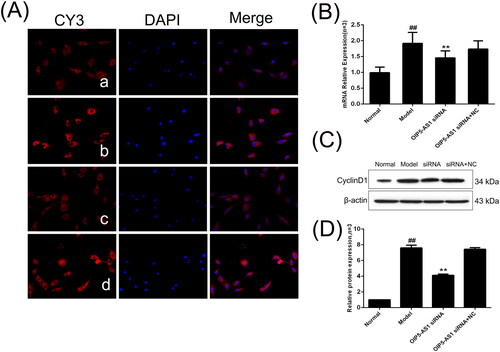
Figure 10. The changes of GSK-3β and p-GSK-3β (Ser9) protein and mRNA expression in FLSs from AA rats after lncRNA OIP5-AS1 siRNA. (A) The change of p-GSK-3β (Ser9) protein expression was observed by immunofluorescence (×200; a: normal group; b: model group; c: lncRNA OIP5-AS1 siRNA group; and d: lncRNA OIP5-AS1 siRNA + NC group). (B) The change of GSK-3β mRNA expression was evaluated by qRT-PCR. (C) The change of p-GSK-3β (Ser9)/GSK-3β protein expression was evaluated by Western blot analysis. (D) Semiquantitative analysis of p-GSK-3β (Ser9)/GSK-3β protein. ##P<0.01 compared to the normal group; *P<0.05 and **P<0.01 compared to the model group. Normal: normal synovial cells; Model: FLSs from AA rats; OIP5-AS1 siRNA: lncRNA OIP5-AS1 siRNA2; OIP5-AS1 siRNA + NC: negative control for siRNA.
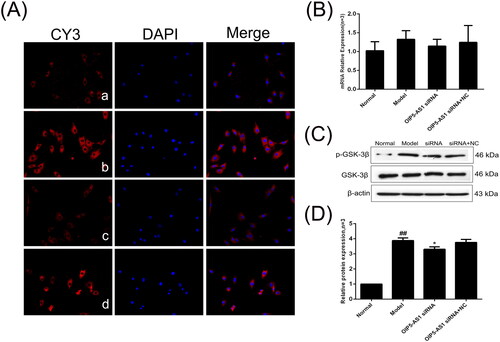
Figure 11. The changes of SFRP4 protein and mRNA expression in FLSs from AA rats after lncRNA OIP5-AS1 siRNA. (A) The change of SFRP4 protein expression was observed by immunofluorescence (×200; a: normal group; b: model group; c: lncRNA OIP5-AS1 siRNA group; and d: lncRNA OIP5-AS1 siRNA + NC group). (B) The change of SFRP4 mRNA expression was evaluated by qRT-PCR. (C) The change of SFRP4 protein expression was evaluated by Western blot analysis. (D) Semiquantitative analysis of SFRP4 protein. ##P<0.01 compared to the normal group; *P<0.05 and **P<0.01 compared to the model group. Normal: normal synovial cells; Model: FLSs from AA rats; OIP5-AS1 siRNA: lncRNA OIP5-AS1 siRNA2; OIP5-AS1 siRNA + NC: negative control for siRNA.
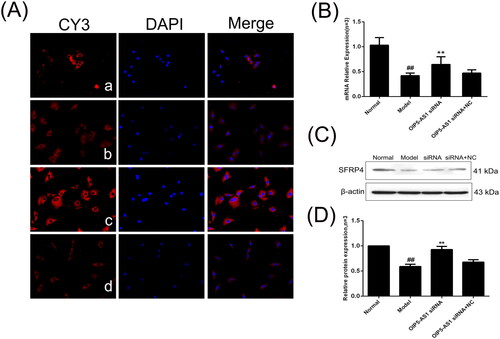
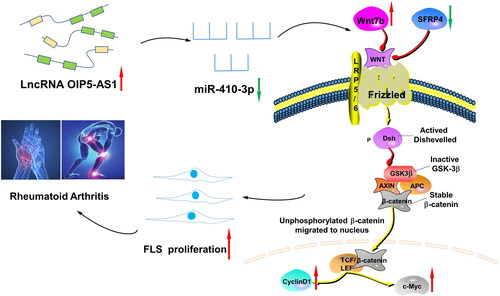
Figure 12. The lncRNA OIP5-AS1/miR-410-3p/Wnt7b axis promotes the proliferation of RA FLSs via regulating the Wnt/β-catenin pathway. When RA occurs, the expression of lncRNA OIP5-AS1 in FLSs increases, and the expression of miR-410-3p decreases after the competition. At the same time, the expression of Wnt7b, β-catenin, c-Myc, and cyclin D1 increases, which promotes the phosphorylation of GSK-3β, decreases the expression of SFRP4, activates the Wnt/β-catenin signalling pathway, and promotes FLS proliferation, thereby participating in the pathogenesis of RA.
Availability of data and materials
All data generated or analysed during this study are included in this published article.