
Figures & data
Figure 1. The workflow of this study.
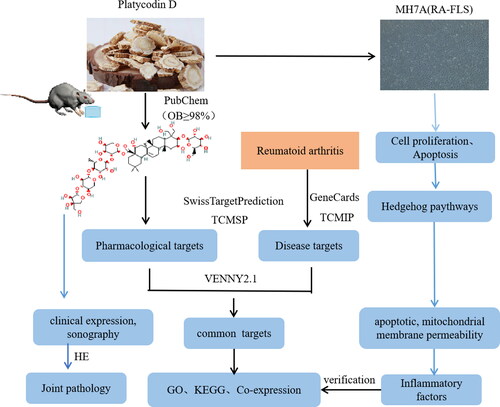
Figure 2. Arthritis score and paw volume. A–E: Normal; Model; PD (5 mg/kg); PD (15 mg/kg); LEF (1.8 mg/kg) treatments. F and G: the effects of each group at arthritis score and paw volume.
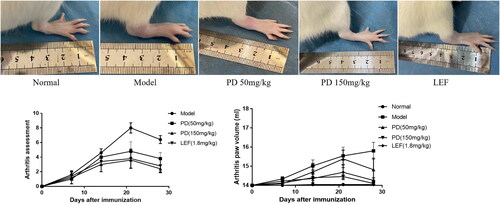
Figure 3. The effects of each group treatments on rat (A) iconography of synovial thickness, (B) change of histopathology, (C) the ankle was evaluated in each group using a scoring system including cellular infiltration, synovial proliferation, cartilage erosion, and pannus formation. Data are expressed as the mean ± S.D, n = 3,*p<0.05, **p<0.01 vs. model.
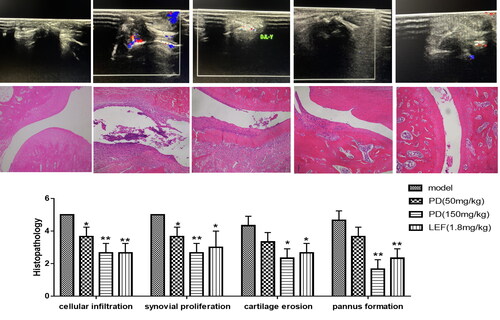
Figure 4. Venn diagram of shared biological targets (A) and molecular functions (B). GO enriched terms of potential targets for biological processes (C) and KEGG enriched terms (D).
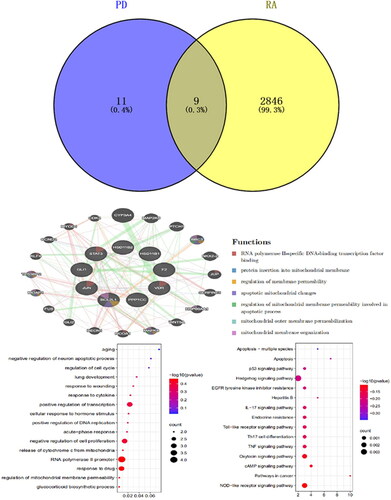
Figure 5. A: The rate of 24-h inhibition by PD (EC50 = 0.949); (B) the rate of 48-h inhibition by PD (EC50 = 0.8863); (C) flow cytometric analysis diagram, apoptosis is divided into four quadrants: Q1-UL (necrotic cells and debris), Q1-UR (late apoptotic cells), Q1-LL (normal cells), Q1-LR (early apoptotic cells); the sum of Q1-UR and Q1-LR; FL1-A: Annein-V staining, FL2-A: PI staining and effect of platycodin D was measured by flow cytometry on apoptosis of MH7A cells.
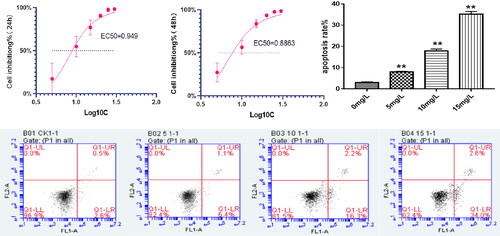
Table 1. Effect of platycodin D on proliferation of MH7A cells (x ± s, n = 5).
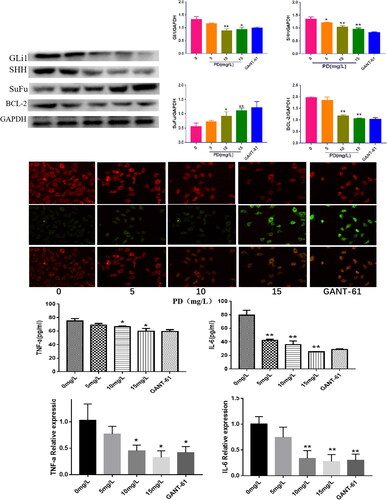
Figure 6. A: The expression levels of SHH, Gli, SuFu, and Bcl-2 in different groups (means ± SD, n = 3, p < 0.05), as compared with the control group; (B) changes in mitochondrial membrane potential in cells from different groups; (C and D) the Effects of PD on changes in TNF-a and IL-6 inflammatory factors of RA-FLS.
Data availability statement
All data generated or analyzed during this study are included in this published article.