
Figures & data
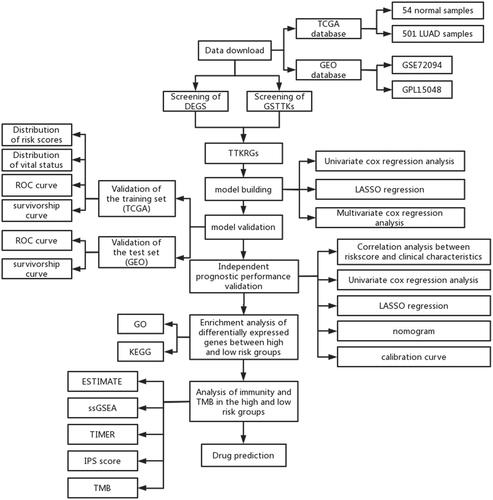
Figure 1. Construction of TTKRGs risk prognostic model in LUAD. (A) Upset plot of DEGs and GSTTKs between LUAD samples and normal samples. (B) Coefficient distribution plot generated for log (λ) sequences in LASSO model; the value of λ determines how many genes have coefficients that can remain. The parameter corresponding to the dashed line on the left is lambda.min, which is the value selected this time. (c) LASSO coefficient profile analyzed by LASSO-Cox; A line represents a gene, and the ordinate is the coefficient of that gene. (D) Forest plot of six signature genes obtained by multivariate regression analysis. The dashed line indicates HR = 1, HR < 1 stands for protective factor, and HR > 1 represents risk factors.
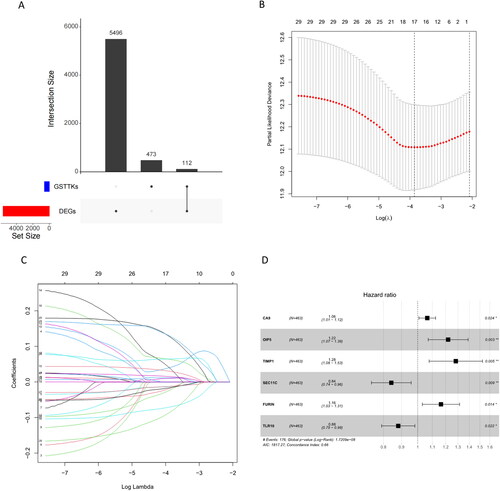
Figure 2. Validation of TTKRGs risk prognostic model in LUAD. (A) Risk score distribution of LUAD samples (blue: low-risk score, red: high-risk score). (B) Scatter plot showing the survival status of LUAD patients according to the risk score distribution (blue points are surviving patients, and red points are dead patients). (C) ROC curves of the training set samples. The larger the AUC value, the better the prediction performance of the model classifier. (D) K–M survival analysis of high- and low-risk groups of training set samples. (E) ROC curves of the validation set samples. (F) K–M survival analysis of high- and low-risk groups of the validation set samples. When p < 0.05 indicates a significant difference in survival status between the two groups.
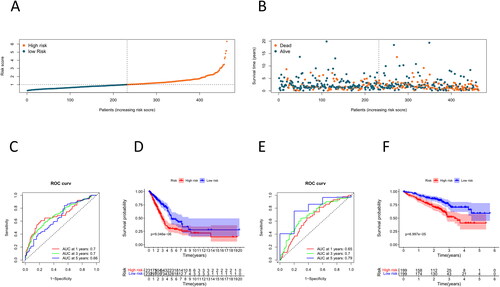
Figure 3. Analysis of the independent prognostic capability of risk score model. (A–C) Number of patients at the TNM stage in the high- and low-risk groups. (D–E) Forest plot for univariate and multivariate regression analyses of prognostic model risk score combined with clinical information; the nomogram was used to assess the significance of risk scores and clinical factors on patient survival. (F) Nomogram of prognostic model risk score combined with clinical information. Each value level of each influencing factor was scored, and then the scores were added to obtain the total risk score of the patient. (G–I) 1 year, 3 years, and 5 years risk prediction calibration curves. The abscissa is the predicted probability, and the ordinate is the observed actual rate. The better the fit, the higher the prediction accuracy of the nomogram.
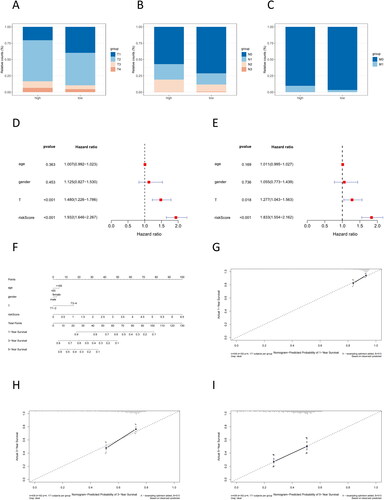
Figure 4. GO and KEGG enrichment analyses. (A) GO enrichment analysis result; (B) KEGG enrichment analysis result
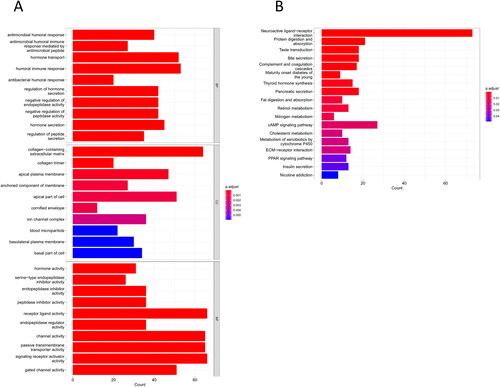
Figure 5. Differences in TME between high- and low-risk groups. (A) Differential analysis of stromal score, immune score, and ESTIMATE score in the high- and low-risk groups. (B) Immune component heatmap in the high- and low-risk groups of LUAD tumor samples. (C) Violin map of differential analysis of immune cell component in the high- and low-risk groups. (D) Violin map of differential analysis of immune function in the high- and low-risk groups; blue represents the low-risk group of LUAD, and red represents the high-risk group of LUAD. (E) TIMER was used to analyze the difference in immune infiltration between high- and low-risk groups. p < 0.05 indicates a significant difference in the index between the two groups.
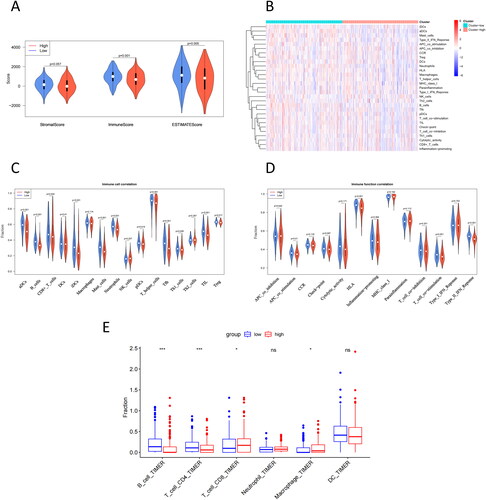
Table 1. Correlation analysis of risk score with immune cell score and immune function score.
Figure 6. IPS for high- and low-risk groups. (A) IPS score. (B) IPS-CTLA4 blocker score (PD-1/PD-L1/PD-L2 negative and CTLA-4 positive). (C) IPS-PD1/PDL1/PDL2 blocker score (PD-1/PD-L1/PD-L2 positive and CTLA-4 negative). (D) IPS-CTLA4/PD1/PDL1/PDL2 blocker score (CTLA-4/PD-1/PD-L1/PD-L2 positive).
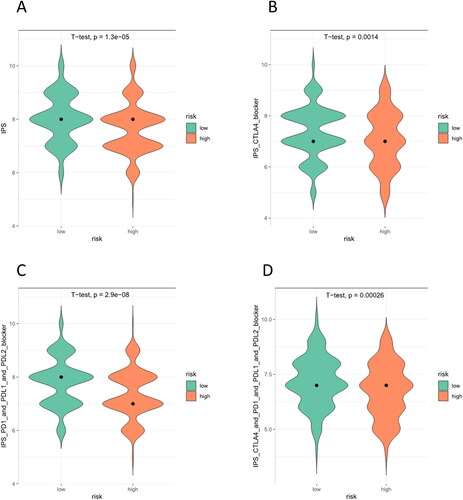
Figure 7. TMB waterfall plot of top 30 genes in high- (A) and low-risk (B) groups. The abscissa corresponds to the patient sample. The ordinate represents the gene.
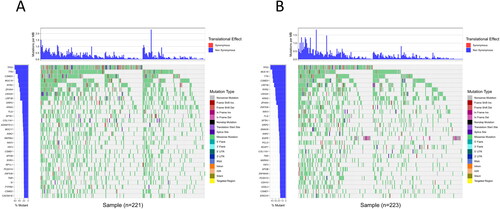
Table 2. Chi-square test results for gene mutation frequency in high- and low-risk groups.
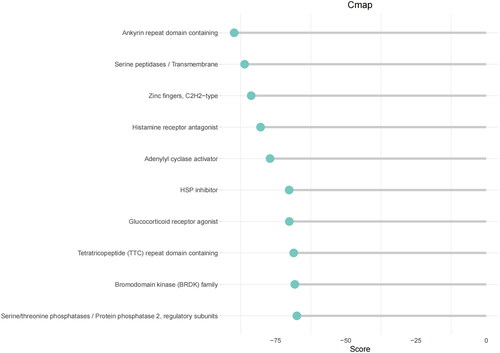
Figure 8. Prediction of small molecule drugs.
Supplemental Material
Download Zip (44.2 KB)Data availability statement
The data that support the findings of this study are available on request from the corresponding author.