
Figures & data
Figure 1. PA2 inhibits cell survival. (A) the Chemical structure of PA2. (B) Cell survival after LX-2 cells were treated with 25, 50, 100, and 200 μM PA2. n = 3. ***p < 0.001.
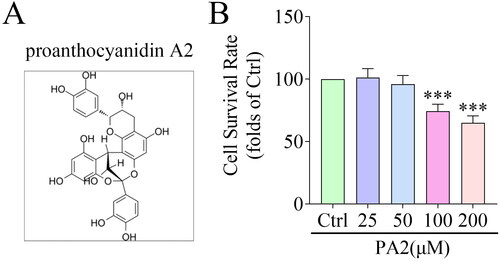
Figure 2. PA2 inhibits TGF-β1-induced HSC activation. (A) Cell viability of LX-2 cells after being treated with TGF-β1 and PA2. The expression of (B) collagen I, (C) fibronectin, and (D) α-SMA was measured using qPCR. (E) Western blot evaluated the collagen I, fibronectin, and α-SMA levels. (D) The fluorescence signal of fibronectin in LX-2 cells. n = 3. ***p < 0.001 and **p < 0.01 vs. the control group. ###p < 0.001 and ##p < 0.01 vs. the TGF-β1 group.
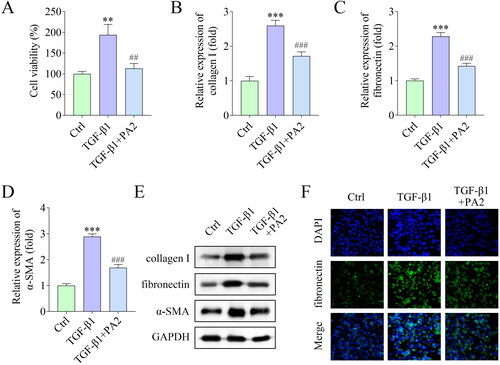
Figure 3. PA2 promotes the activation of the PPAR-γ signalling pathway. (A) the heatmap showed that the top ten upregulated and top ten downregulated mRNAs were analysed using RNA-seq. (B) the enrichment analysis of the Dysregulated mRNAs was analysed by the bioinformatic analysis. (C) The PPAR-γ signalling pathway-related factors were predicted using the bioinformatic analysis. (D) The protein levels of PPAR-γ, Smad2, p-Smad2, Smad3, and p-Smad3 were measured. n = 3.
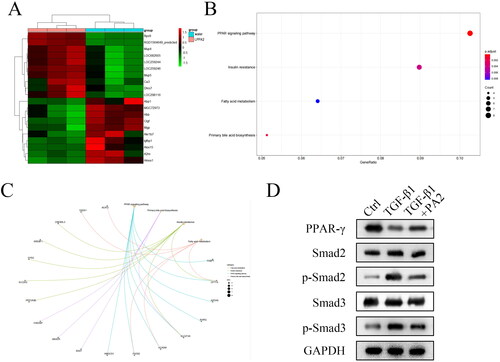
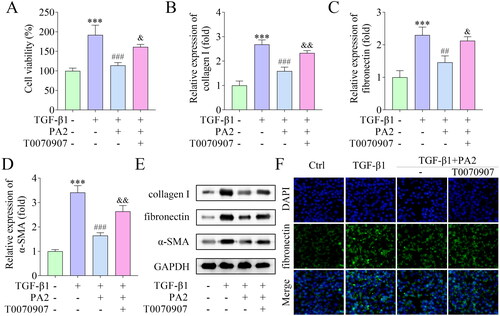
Figure 4. PA2 inhibited TGF-β1-induced HSC activation via the PPAR-γ pathway. (A) Cell viability of LX-2 cells after being treated with TGF-β1, PA2, and T0070907. The expression of (B) collagen I, (C) fibronectin, and (D) α-SMA was measured using qPCR. (C) Western blot evaluated the collagen I, fibronectin, and α-SMA levels. (D) The levels of fibronectin were assessed by IF assay. n = 3. ***p < 0.001 vs. the control group. ###p < 0.001 and ##p < 0.01 vs. the TGF-β1 group. &&p < 0.01 and &p < 0.05 vs the TGF-β1 + PA2 group.
Data availability statement
The datasets used and/or analysed during the current study are available from the corresponding author upon reasonable request.