Figures & data
Table 1. The Primer sequences for qRT-PCR.
Figure 1. Circ_0006944 level was up-regulated in SA-AKI patients and LPS-exposed HK2 cells. (A) The abundance of circ_0006944 was estimated in SA-AKI patients and healthy volunteers by qRT-PCR. (B) The diagnostic value of circ_0006944 assessed by the ROC curve. (C) Circ_0006944 level was explored in HK2 cells after stimulation by different doses of LPS. (D) The circular characteristic of circ_0006944 was determined by RNase R treatment. (E) Random and Oligo(dT)18 primers were applied to explore the level of circ_0006944 and GAPDH in reverse transcription. (F) Subcellular localisation assays was executed to uncover the distribution of circ_0006944 in HK2 cells. *p < 0.05, ***p < 0.001, ****p < 0.0001.
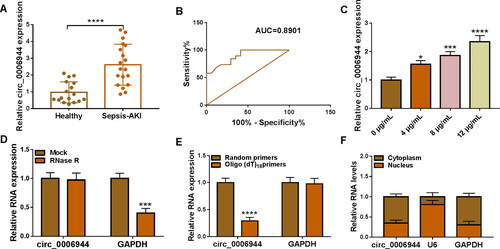
Figure 2. LPS treatment caused HK2 cell injury. (A-J) HK2 cells were evoked to different concentrations of LPS (0, 4, 8 and 12 µg/mL) for 24 h. (A-B) Cell proliferation was checked by using CCK-8 and EdU assays. (C,D) Flow cytometry was implemented for cell apoptosis analysis. (E) The protein levels of Bax and Cleaved-caspase-3 was gauged by western blot analysis. (F–H) ELISA analysis were performed to measure the levels of IL-6, IL-1β and TNF-α. (I–J) The levels of MDA and SOD was analysed via using commercial kits. *p < 0.05, **p < 0.01, ***p < 0.001, ****p < 0.0001.
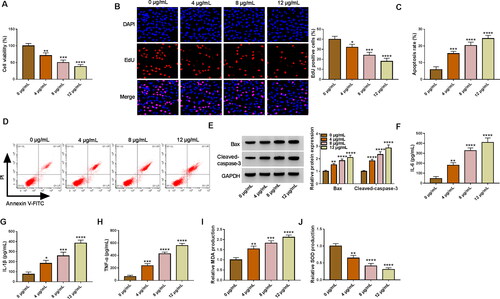
Figure 3. Circ_0006944 knockdown weakened the damage of HK2 cells caused by LPS treatment. HK2 cells were assigned to 4 groups: Control, LPS, LPS + si-NC and LPS + si-circ_0006944. (A) Circ_0006944 expression was tested by qRT-PCR assay. (B-D) CCK-8 assay, EdU assay and flow cytometry were implemented to investigate the viability, proliferation and apoptosis in HK2 cells, respectively. (E) Western blot assay was used to monitor the protein levels of Bax and Cleaved-caspase-3. (F-H) The concentrations of IL-6, IL-1β and TNF-α were counted via ELISA kits. (I-J) The production of MDA and SOD was checked by relevant kits. **p < 0.01, ***p < 0.001, ****p < 0.0001.
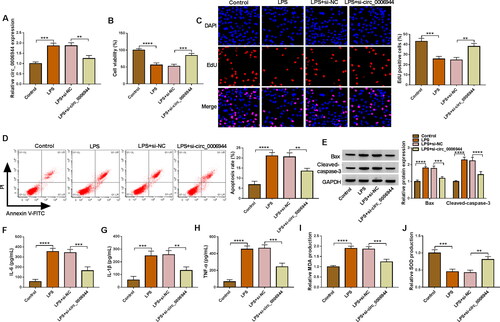
Figure 4. Circ_0006944 acted as a sponge of miR-205-5p. (A) Three miRNAs targeted by circ_0006944 were predicted by starbase and circBank databases. (B) The abundance of miRNA in si-NC and si-circ_0006944-transfected HK2 cells was monitored by qRT-PCR. (C) The predicted binding sites between circ_0006944 and miR-205-5p were shown. (D) MiR-205-5p level in HK2 cells transfected with miR-NC or miR-205-5p was assessed by qRT-PCR. (E-F) Dual-luciferase reporter assay and RIP assay were utilised to investigate the targeted relationship between miR-205-5p and circ_0006944. (G) MiR-205-5p abundance was obtained in SA-AKI patients and healthy volunteers by using qRT-PCR assay. (H) QRT-PCR was adopted to prove the effect of LPS (0, 5, 10 and 15 µg/mL) on miR-205-5p level. (I) Pearson correlation analysis was applied to estimate the correlation between circ_0006944 and miR-205-5p in SA-AKI patients. **p < 0.01, ***p < 0.001, ****p < 0.0001.
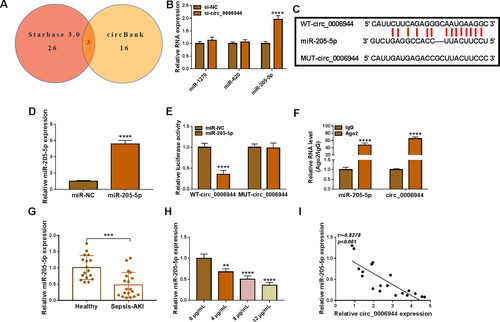
Figure 5. Effects of circ_0006944 downregulation and miR-205-5p inhibiter on LPS-induced HK2 cell dysfunction. HK2 cells were transfected with si-NC, si-circ_0006944, si-circ_0006944 + anti-miR-NC or si-circ_0006944+ anti-miR-205-5p, and then evoked with 10 μg/mL LPS for 24 h. (A) The abundance of miR-205-5p was counted by qRT-PCR. (B-E) The viability, proliferation and apoptosis was evaluated by CCK-8 assay, EdU assay and flow cytometry in HK2 cells. (F) The protein levels of Bax and Cleaved-caspase-3 were investigated with western blot assay. (G-I) The concentrations of IL-6, IL-1β and TNF-α were determined using ELISA assay. (J-K) The production of SOD and MDA levels were gauged using commercial kits. *p < 0.05, **p < 0.01, ***p < 0.001, ****p < 0.0001.
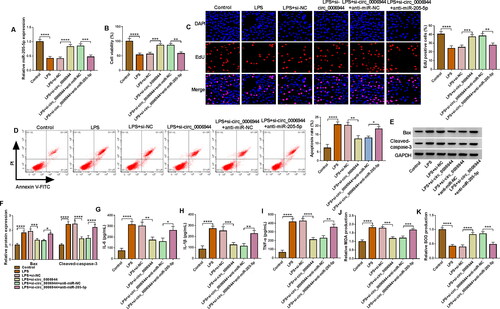
Figure 6. UBL4A was a target for miR-205-5p. (A) The interaction sites between UBL4A 3’UTR and miR-205-5p were observed by starbase software. (B-C) The targeting relationship was demonstrated by dual-luciferase reporter and RIP assays. (D) The mRNA abundance of UBL4A was obtained by using qRT-qPCR in SA-AKI patients and and healthy controls. (E) Pearson’s correlation analysis was employed to disclose the relationship between the expressions of miR-205-5p and UBL4A. (F) UBL4A protein level was measured via western blot in LPS-triggered HK2 cells. **p < 0.01, ****p < 0.0001.
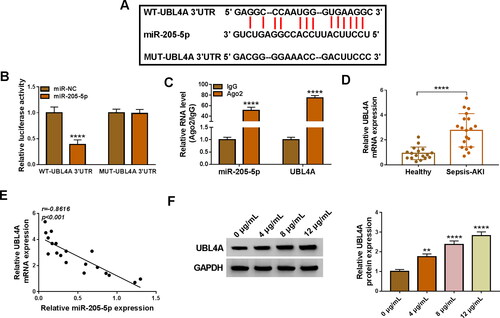
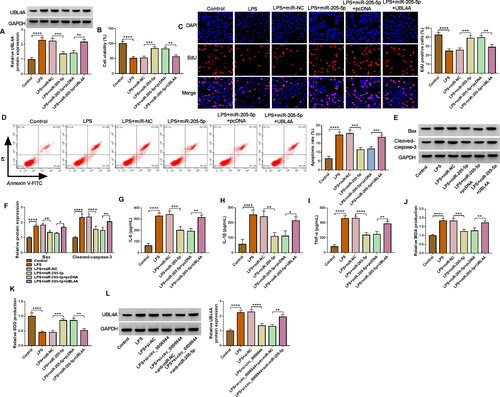
Figure 7. UBL4A was a functional target of miR-205-5p in regulating LPS-evoked HK2 cells damage. HK2 cells were transfected with or without miR-NC mimic, miR-205-5p mimic, miR-205-5p mimic + pcDNA or miR-205-5p mimic + UBL4A and then treated with 10 μg/mL LPS for 24 h. (A) The protein level of UBL4A was revealed through using western blot assay. (B-C) The proliferation ability of HK2 cells was demonstrated by CCK-8 assay and EdU assay. (D-E) HK2 cells apoptosis rate was analysed by flow cytometry assay. (F) Protein levels of Bax, Cleaved-caspase-3 were assessed by western blot assay. (G-I) IL-6, IL-1β and TNF-α levels were gauged by ELISA kit. (J,K) Assay kits measured relative MDA level and SOD activity. (L) Western blot analysis for the abundance of UBL4A in LPS-induced HK2 cells transfected with si-NC, si-circ_0006944, si-circ_0006944 + anti-miR-NC or si-circ_0006944 + anti-miR-205-5p. *p < 0.05,**p < 0.01, ***p < 0.001 or ****p < 0.0001.