
Figures & data
Table 1. Basic information of each group.
Figure 1. Comparison of the expression levels of serum IL-17, TNF-α and DKK-1 in each group, **p < 0.001; *p < 0.05.
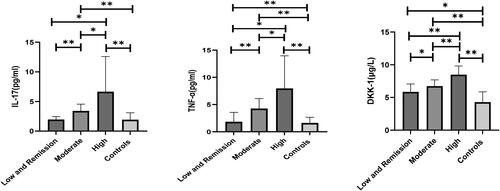
Figure 2. Correlation of serum IL-17, TNF-α and DKK-1 with clinical data.
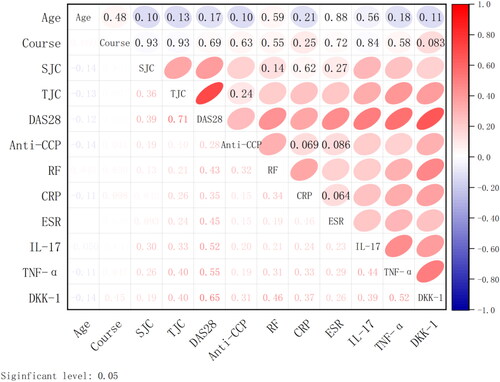
Figure 3. Relationship between DAS28 scores and the expression levels of IL-17, TNF-α and DKK-1 in RA.
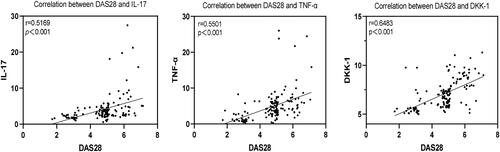
Figure 4. The ROC curve for each indices to diagnose RA.
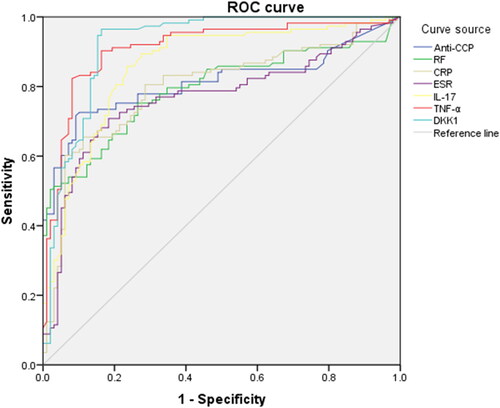
Table 2. Clinical evaluation of research indices.
Figure 5. ROC Curves of IL-17, TNF-α and DKK-1 for the diagnosis of moderate to high activity RA.
Note: ROC, subject operating characteristic curve.
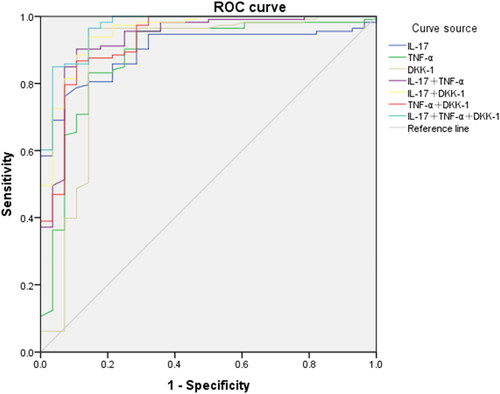
Table 3. Clinical evaluation of IL-17, TNF-α and DKK-1 in the diagnosis of moderate to high activity RA.
Data availability statement
The data that support the fundings of this study are availability from the corresponding author [QW], upon reasonable request.