
Figures & data
Figure 1. Isoaspartyl modification and its repair enzyme, PIMT, are associated with lupus autoimmunity. T-cell hyperproliferation was characterized in cells prepared from lupus-prone mice (a) and SLE patients (b). CD4 T cell proliferation assay either from lupus-prone MRL+/+, MRL/lpr and control B10. BR mice (n = 3 for each strain of mouse model) or from SLE patients (n = 20) and healthy donors/subjects (n = 10) were measured in traditional 3H-thymidine incorporation assay as described in Methods. (c) The isoAsp amount in erythrocyte membrane proteins under oxidative stress from SLE patients (n = 28) and healthy donors/subjects (n = 20) were measured by isoAsp vapor assay as described in Methods. (d) The linear association of PIMT and isoAsp amount (slope) was significantly different between healthy donors/subjects and SLE patients (p = 0.01). Specifically, with 1 unit increase in PIMT activity, SLE patients have 0.212 units decrease in fold change of isoAsp amount (oxidative stress group/control group). (*p < 0.05 and **p < 0.005 by Student’s t-test).
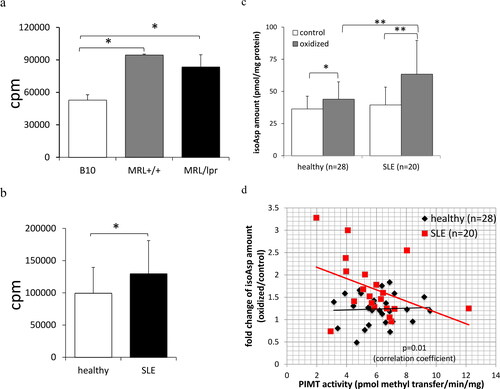
Figure 2. Characterization of retrotransduced PIMT enzyme in primary murine CD4 T cells. (a) The infection efficiency of retrovirus carried PIMT (PIMT-MSCV) or MSCV vector only (Mock) was similar in all groups as determined by flow cytometry after five days infection, i.e. the percentage of CD4+Thy1.1+ cells. Retro-transduced PIMT mRNA expression by RT-PCR (b) and protein expression by western blot (c) was measured in purified CD4+Thy1.1+ T cells infected by PIMT-MSCV or vector only (Mock) as described in Methods; GAPDH serves as loading control as shown in the bottom panel in (b) and (c). (d) The isoAsp amount was measured by vapor assays as same as in from CD4+Thy1.1+ T cell lysate from PIMT-MSCV or vector only (Mock) group. Data represent mean ± SD and are representative of more than two independent experiments. (*p < 0.05 by Student’s t-test).
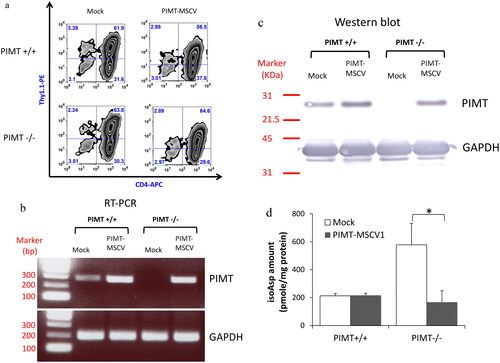
Figure 3. PIMT ameliorates aberrant lupus T cell hyperproliferation. (a) Schematic representation of strategy for MSCV retrovirus infection, cell stimulation and CFSE proliferation assay on CD4 T cells. The CD4 T cells labeled with CFSE dye and transduced with a retroviral vector expressing PIMT (MSCV-PIMT) or empty vector (Mock) were incubated for another four days to analysis T cell proliferation or stimulated either by CD3/CD28 Dynabeads or antigen again for further proliferation analysis. (b) Upon second stimulation by CD3/28 Dynabeads, flow cytometry of CFSE diluting index from CD4+ EMA-Thy1.1+ T cells transduced with PIMT-MSCV or Mock from PIMT−/− and wild type mouse. EMA (ethidium monoazide), a viability marker. Bottom, the percentages of proliferating CD4+ EMA-Thy1.1+ T cells are represented as mean ± SD. *p < 0.05 by Student’s t-test. (c) Flow cytometry of CFSE diluting index from CD4+ Thy1.1+ T cells transduced with PIMT-MSCV or Mock from B10 or MRL AND transgenic mouse upon PCC88-104 peptide stimulation in the presence of mitomycin c-treated CH27 B cells at Day 12. (d) CFSE-labeled MRL.AND transgenic CD4 T cells transduced with MSCV-PIMT or Mock were intraperitoneal (i.p.) injected into mPCC-transgenic (MRLxB10) F1 recipient mice. Before adoptive transfer, recipient mice were i.p. injected with 3% thioglycollate to elicit antigen-presenting macrophage. Three days later, CFSE diluting index of CD4+Thy1.1+ population was shown in peritoneal cavity (top panel) or in spleen (bottom panel). (n ≥ 3 per group). Data are representative of more than four independent experiments in (b, c) or two independent experiments in (d).
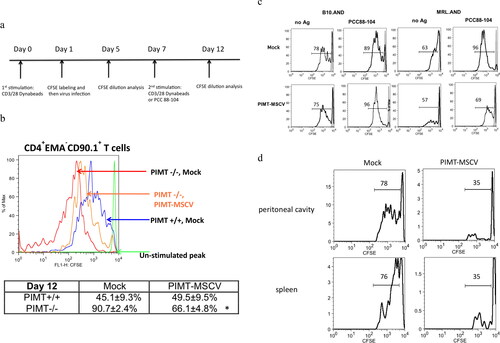
Figure 4. PIMT suppresses ZAP70 (Tyr 319) phosphorylation upon Ag stimulation. B10.AND and MRL.AND transgenic CD4 T cells were retrotransduced with PIMT-MSCV or vector only (Mock) as similar described in . After 30 min upon second stimulation by the PCC88-104 peptide, intracellular staining for phosphor-ZAP70 at Tyr 319 residue (a) is shown in CD4+Thy1.1+ (top panel) and in CD4+Thy1.1- (bottom panel) population. The other TCR signaling proteins, phosphor-MEK1/2, phosphor-ERK1/2, and phosphor-CREB, were simultaneously analyzed as shown in (b). Young, 12–14 weeks old. Old, 11 months old. Data are representative of two independent experiments.
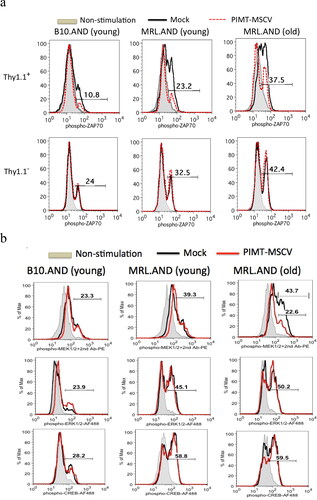
Figure 5. Isoaspartyl modification in aged ZAP70 protein. (a) The isoaspartyl (isoAsp) content was measured in aged (incubation for 2 weeks at 37 °C) or in native (unaged) form of human recombinant ZAP70 protein. Data are representative of two independent experiments. (b) Amino acid sequence of human ZAP70. Putative isoAsp hot spots are shown in red bold and Tyr 315 and Tyr319 phosphorylation sites are shown in blue bold and underlined. The locations of isoAsp residue identified by mass spectrometry (Supplementary Table 1) in this study are indicated with red reversed caret. (c) Top panel: The functional domains of ZAP70 structure. Phosphorylation site for downstream Lck kinase (Y319) is indicated at the bottom. The locations of isoAsp residue that arose during in vitro aging of human recombinant ZAP70 are indicated on the top, D92, D290, D303, and D394. I-A; interdomain A. I-B; interdomain B. Bottom panel: highlighted D92, D290, D303, and D394 residues in the crystal structure of human ZAP70 (PDB 2OZO).
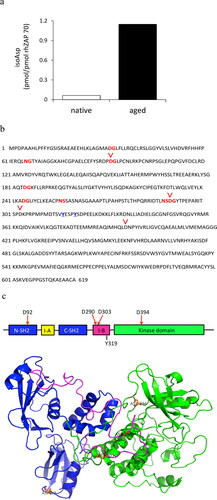
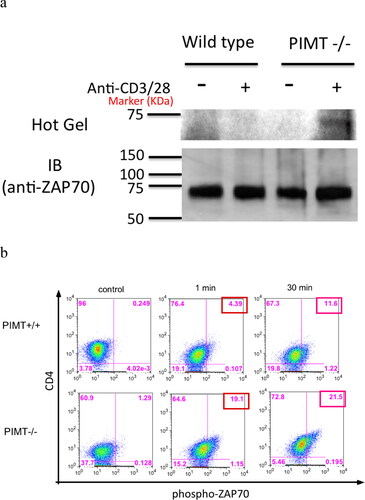
Figure 6. Isoaspartyl modification alters ZAP70 TCR signaling pathway. CD4 T cells were isolated from PIMT−/− or wild-type mice and stimulated with anti-CD3 and anti-CD28 mAb. (a) Cells lysates were labeled with 3H-SAM by in vitro PIMT reaction, then immunoprecipitated by polyclonal anti-ZAP70 antibody followed by further analysis for 3H fluorography (top panel, Hot Gel) or immunoblot (bottom panel, IB) in parallel as described in Methods. (b) Upon anti-CD3 and anti-CD28 mAb stimulation, intracellular staining for phosphor-ZAP70 at Tyr 319 residue at different time course in CD4 T cells is shown from PIMT +/+ (top panel) or from PIMT−/− (bottom panel) mice. Data are representative of two independent experiments.
Supplemental Material
Download MS Word (507.7 KB)Data availability statement
The data that support the findings of this study are available from the corresponding author upon reasonable request.