
Figures & data
Figure 1. IRN inhibits MH7A cell proliferation induced by TNF-α. a. The chemical structure of IRN. b. The effect of IRN on cell viability of MH7A cell by CCK8 assay. c. The proliferation of MH7A cells induced by TNF-α with or without IRN. #p < 0.05, ##p < 0.01, ###p < 0.01 vs TNF-α group. *p < 0.05, **p < 0.01, ***p < 0.001 vs control group.
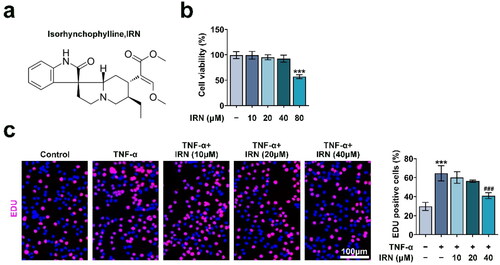
Figure 2. IRN blocks TNF-α-induced migration and invasion in MH7A cells. a. Transwell assay detected the cell invasion of MH7A cells induced by TNF-α with or without IRN. b. The ability of cell migration in MH7A cells induced by TNF-α with or without IRN. #p < 0.05, ##p < 0.01, ###p < 0.01 vs TNF-α group. *p < 0.05, **p < 0.01, ***p < 0.001 vs control group.
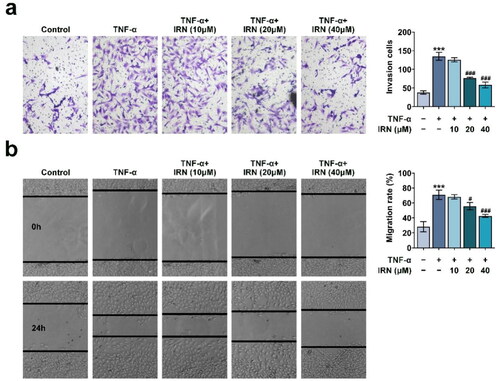
Figure 3. IRN inhibits Proinflammatory Cytokines and MMPs in TNF-α-induced MH7A cells. a. IRN reduced pro-inflammatory cytokines and MMPs in MH7A cell as detected by ELISA. b. The levels of pro-inflammatory cytokines and MMPs in MH7A cell as detected by western blot. #p < 0.05, ##p < 0.01, ###p < 0.01 vs TNF-α group. *p < 0.05, **p < 0.01, ***p < 0.001 vs control group.
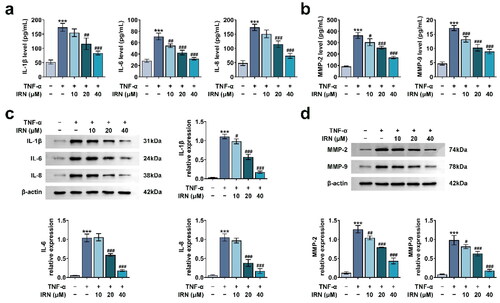
Figure 4. IRN inhibits FOXC1/β-catenin pathway in MH7A cells. a. The levels of FOXC1 and β-catenin in MH7A cell treated as labelled as detected by western blot. b. The cellular location of β-catenin in MH7A cell induced by TNF-α with or without IRN. #p < 0.05, ##p < 0.01, ###p < 0.01 vs TNF-α group. *p < 0.05, **p < 0.01, ***p < 0.001 vs control group.
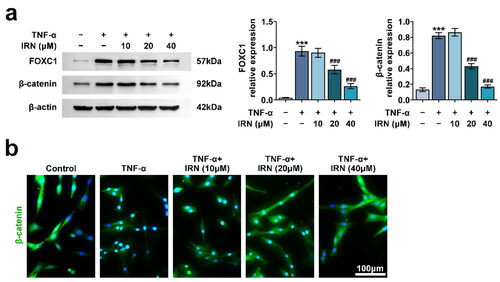
Figure 5. IRN inhibits cell proliferation and migration by restraining FOXC1/β-catenin pathway in MH7A cells. a. The proliferation of MH7A cells induced by TNF-α and IRN with or without FOXC1 transfection. b. Transwell assay detected the cell invasion of MH7A cells induced by TNF-α and IRN with or without FOXC1 transfection. c. The ability of cell migration in MH7A cells induced by TNF-α and IRN with or without FOXC1 transfection. #p < 0.05, ##p < 0.01, ###p < 0.01 vs TNF-α group. *p < 0.05, **p < 0.01, ***p < 0.001 vs control group.
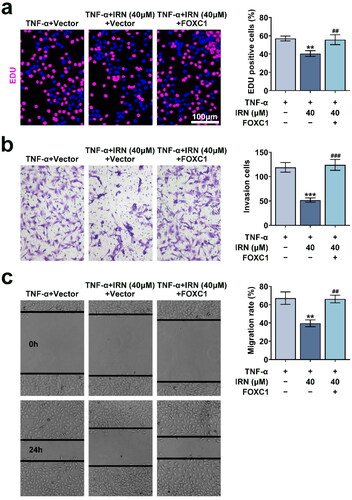
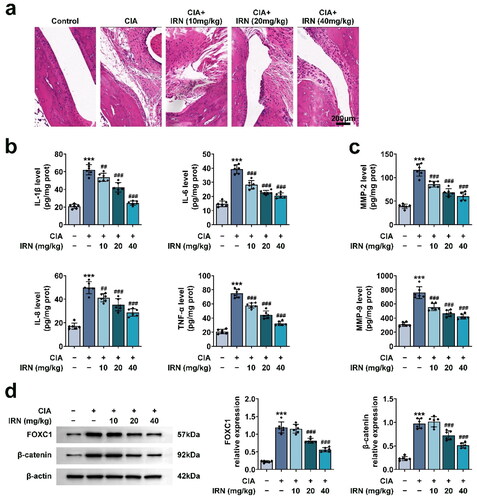
Figure 6. IRN restores CIA by inhibiting pro-inflammatory cytokines in synovial tissues. a. Representive images of HE staining in each group. b. The levels of proinflammatory cytokines (TNF-α, IL-1β, IL-6, IL-8) in various groups, detected by ELISA. c. The levels of MMPs (MMP-2, MMP-9) in various groups, detected by ELISA. d. The expression of FOXC1 and beta-catenin was detected in various groups via Immunoblot. #p < 0.05, ##p < 0.01, ###p < 0.01 vs TNF-α group. *p < 0.05, **p < 0.01, ***p < 0.001 vs control group.
Supplemental Material
Download MS Word (96.5 KB)Data availability statement
All data generated or analysed during this study are included in this published article.
The datasets used and/or analysed during the present study are available from the corresponding author on reasonable request.