Figures & data
Figure 1. LPS exacerbated HG-induced dysfunction in HPMECs. HPMECs were induced with HG and LPS for 24 h. CCK8 (A), transwell assay (B), tube formation assay (C) and TER assay (D) were used to test cell viability, migration, angiogenesis and TER. (E) FITC-dextran assay for the determination of cell permeability. (F) The protein levels of ZO-1 and VE-cadherin were measured by WB analysis. *p < 0.05; **p < 0.01.
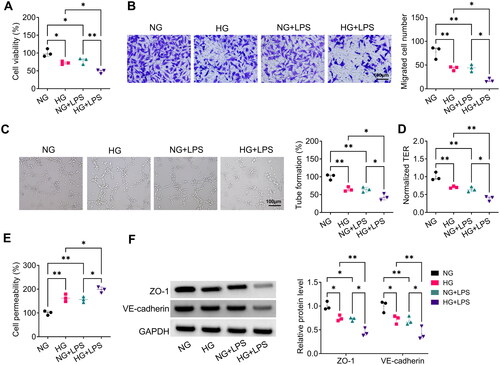
Figure 2. LPS aggravated HG-induced HPMECs injury. (A–C) ELISA was used to test the levels of TNF-α, IL-1β and IL-6. (D–G) Detection of ROS, MDA, GSH and Fe2+ levels to assess ferroptosis. (H) WB analysis for detection the protein levels of SLC7A11 and GPX4. *p < 0.05; **p < 0.01; ***p < 0.001.
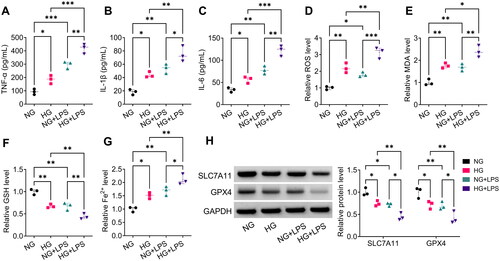
Figure 3. Isolation and identification of exosomes from MSC. (A) Flow cytometry was used to identify CD105, CD73, CD90, CD34, and CD45 in MSC. (B) The results of oil red O and ALP staining. (C) TEM was used to observe the MSC-Exo morphology. (D) NTA for measuring the size and concentration of MSC-Exo. (E) Exosome marker protein (CD63, CD81 and TSG101) and negative protein (Calnexin) were detected by WB analysis. (F) MSC-Exo was labelled with DIO to assess the uptake of MSC-Exo by HPMECs.
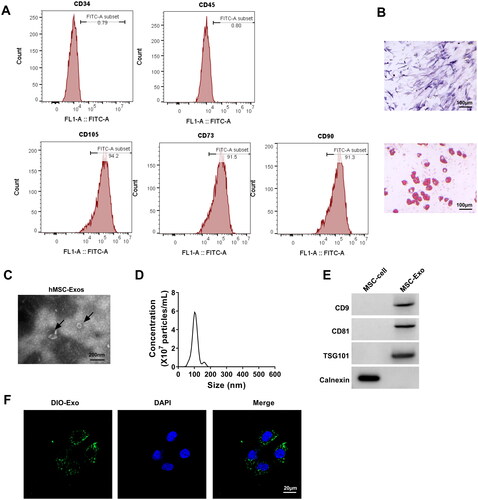
Figure 4. MSC-Exo attenuated HG + LPS-induced HPMECs dysfunction. HPMECs were co-incubated with MSC-Exo and then induced using HG and LPS. Cell viability, migration, angiogenesis and TER were detected using CCK8 (a), transwell assay (B), tube formation assay (C) and TER assay (D). (E) FITC-dextran assay was used to test cell permeability. (F) WB analysis for detection the protein levels of ZO-1 and VE-cadherin. **p < 0.01; ***p < 0.001.
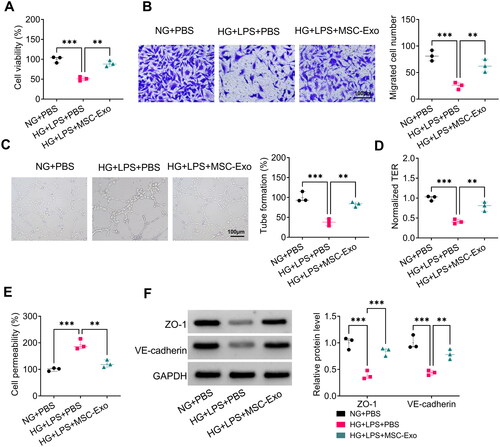
Figure 5. MSC-Exo alleviated HG + LPS-induced injury in HPMECs. (A-C) The levels of TNF-α, IL-1β and IL-6 were detected by ELISA. (D-G) Ferroptosis was assessed by measuring ROS, MDA, GSH and Fe2+ levels. (H) The protein levels of SLC7A11 and GPX4 were tested by WB analysis. *p < 0.05; **p < 0.01; ***p < 0.001.
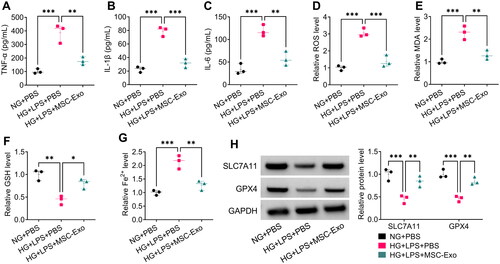
Figure 6. MSC-Exo modulated the Nrf2/HO-1 pathway in HG + LPS-induced HPMECs. (A) The protein levels of Nrf2 and HO-1 were detected by WB analysis in HG + LPS-induced HPMECs co-incubated with MSC-Exo. (B) The transfection efficiency of si-Nrf2 in MSC was confirmed by WB analysis. (C) Exosome was collected from MSC transfected with si-Nrf2/si-NC, and then Nrf2 protein expression was detected by WB analysis. (D) WB analysis was used to measure the protein levels of Nrf2 and HO-1 in HG + LPS-induced HPMECs co-cultured with si-Nrf2-MSC-Exo or si-NC-MSC-Exo. *p < 0.05; **p < 0.01; ***p < 0.001.
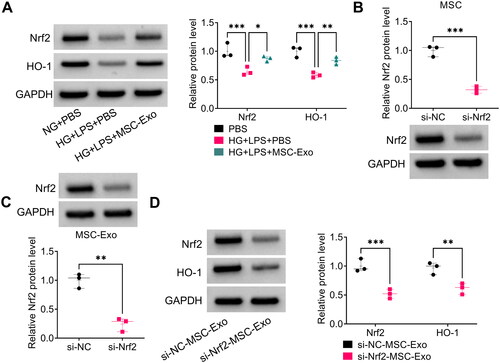
Figure 7. Effect of si-Nrf2-MSC-Exo on HG + LPS-induced dysfunction in HPMECs. HPMECs were co-incubated with si-Nrf2-MSC-Exo or si-NC-MSC-Exo and then induced using HG and LPS. Cell viability, migration, angiogenesis and TER were tested by CCK8 (A), transwell assay (B), tube formation assay (C) and TER assay (D). (E) Cell permeability was measured by FITC-dextran assay. (F) WB analysis was used to detect the protein levels of ZO-1 and VE-cadherin. *p < 0.05; **p < 0.01.
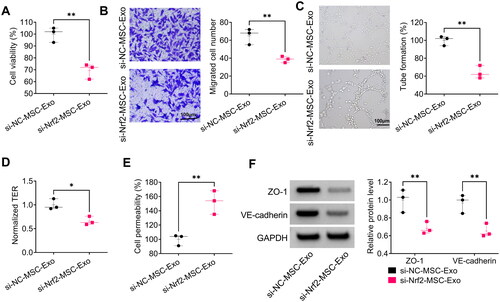
Figure 8. Effect of si-Nrf2-MSC-Exo on HG + LPS-induced injury in HPMECs. (A-C) ELISA was used to detect the levels of TNF-α, IL-1β and IL-6. (D–G) Ferroptosis was assessed by measuring ROS, MDA, GSH and Fe2+ levels. (H) The protein levels of SLC7A11 and GPX4 were test by WB analysis. *p < 0.05; **p < 0.01.
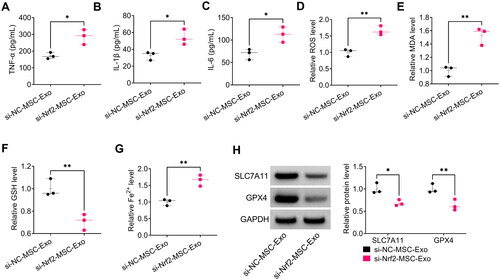
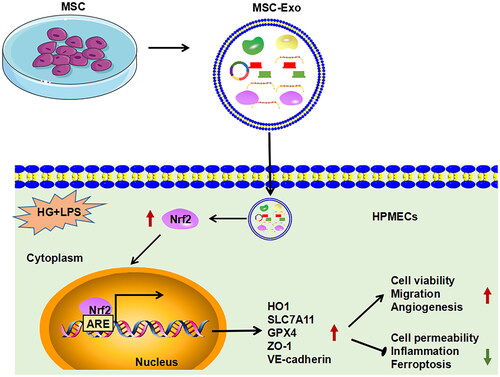
Figure 9. Summary diagram of this study. MSC-Exo promoted viability, migration and angiogenesis, while inhibited permeability, inflammation, and ferroptosis on HG + LPS-induced HPMECs by activating Nrf2/HO-1 pathway.