
Figures & data
Figure 1. The levels of total O-GlcNAcylation and OGT are increased in OA models. A. The level of total O-GlcNAc and the levels of O-GlcNAc cycling enzymes (OGT and OGA) were measured in the cartilage tissues of the OA mice model and the negative control sham mice using western blot. B. The levels of total O-GlcNAc, OGT, and OGA in ATDC5 cells treated with or without LPS were determined by western blot.
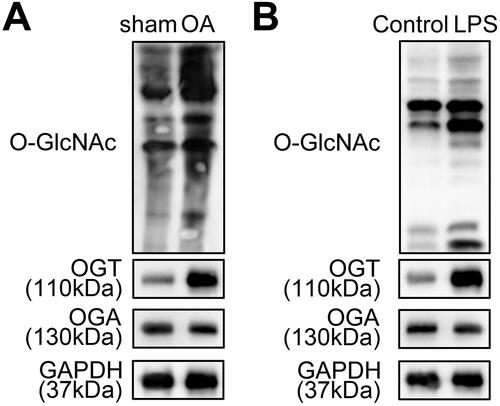
Figure 2. Knockout of OGT mitigates OA progression in model mice. OGT-knockout mice (OGT-/-) were generated for in vivo experiments, and mice with original OGT expression were used as wild-type (WT; OGT+/+). A. The proteoglycan content and cartilage fibrillation and erosion were detected in OGT-knockout OA or Sham mice by Safranin O staining by comparing with OGT+/+ mice. B. IHC analysis of OA markers (MMP13 and Collagen II) in OGT-knockout or sham mice. C. The level of MMP13 was quantified by the IHC score. D. The level of Collagen II was quantified by the IHC score. E. OARSI score was evaluated in different groups of mice. ***P < 0.001: OGT+/+ OA group vs OGT+/+ Sham group; ###P < 0.001 and ##P < 0.01: OGT-/- OA group vs OGT-/- Sham group.
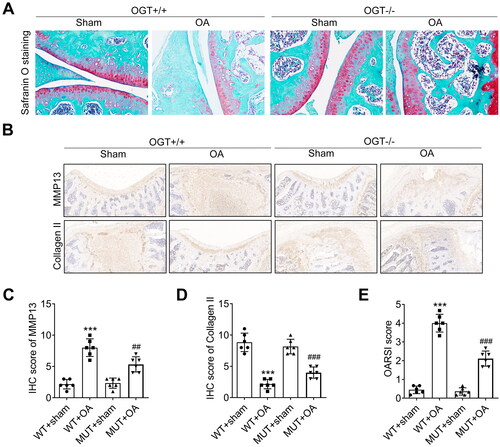
Figure 3. Silencing of OGT suppresses LPS-induced chondrocyte injury. A. OGT expression was knocked down in chondrocytes (ATDC5 cells) with the specific shRNA adenovirus (sh-OGT). The knockdown efficiency was measured using RT-qPCR. B. The viability of LPS-induced ATDC5 cells was assessed by CCK-8 assay after silencing of OGT. C, D. The pyroptosis rate of LPS-induced ATDC5 cells was measured by flow cytometry after silencing of OGT. E. The effect of OGT silencing on LPS-induced LDH release in ATDC5 cells was detected by using an LDH detection kit. F-G. The cellular level of inflammatory cytokines (IL-1β and IL-18) in LPS-induced ATDC5 cells was analysed through ELISA after OGT silencing. H. The levels of pyroptosis-related proteins were examined by western blot. ***P < 0.001: sh-OGT group vs sh-NC group; LPS vs Control group. ###P < 0.001 and ##P < 0.01: LPS + sh-OGT group vs LPS + sh-NC group.
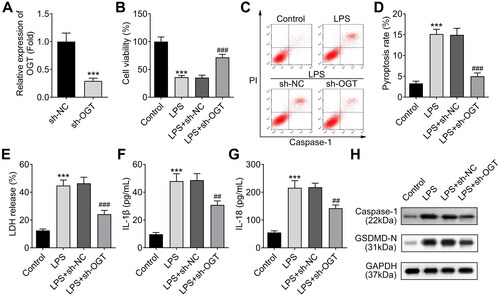
Figure 4. OGT-induced NEK7 O-GlcNAcylation promotes the interaction between NEK and NLRP3 by suppressing the phosphorylation of NEK7. A. The O-GlcNAc level of NEK7 protein in OGT-silenced chondrocytes was measured using western blot. B. The several potential O-GlcNAc sites in NEK7 protein were predicted on DictyOGlyc-1.1. C. The O-GlcNAc level of NEK7 protein was measured in chondrocytes after the four sites were separately mutated. D. The phosphorylation level of NEK7 was detected in OGT-silenced chondrocyte. E. The O-GlcNAc and phosphorylation levels of NEK7 were measured in chondrocytes treated with the O-GlcNAc inhibitor (ST045849). F. The phosphorylation level of NEK7 was detected in chondrocytes after mutation of S204 and S260 using western blot. G. The effect of OGT silence on the binding of NLRP3 to NEK7 was detected through co-IP assay. H-I. The enrichment of NLRP3 or NEK7 in the immunoprecipitates of anti-NEK7. J. The effect of OGT silence on the binding of NEK7 to NLRP3 was detected through co-IP assay. K-L. The enrichment of NEK7 or NLRP3 in the immunoprecipitates of anti-NLRP3. ***P < 0.001.
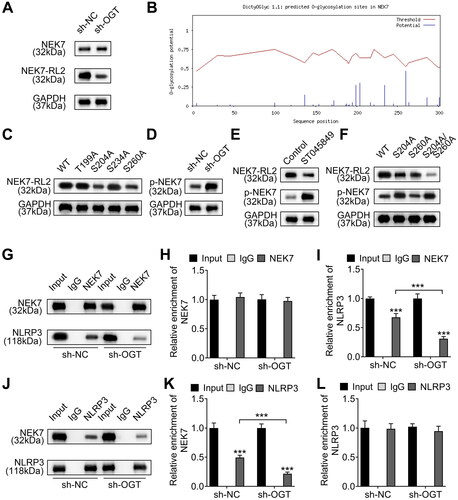
Figure 5. Inhibition of O-GlcNAcylation recovers chondrocytes from LPS-induced injury. A. The viability of LPS-induced chondrocytes was assessed using CCK-8 assay after being treated with the O-GlcNAc inhibitor (ST045849). B-C. The pyroptosis rate of LPS-induced chondrocytes was examined using flow cytometry after ST045849 treatment. D. LPS-induced LDH release could be suppressed by ST045849 treatment, as detected by using an LDH detection kit. E-F. ELISA was used to detect the levels of IL-1β and IL-18 in LPS-induced chondrocytes treated with ST045849. G. The levels of pyroptosis-related proteins (Caspase-1 and GSDMD-N) were determined by western blot in LPS-induced chondrocytes treated with ST045849. ***P < 0.001: LPS group vs control group. ###P < 0.001: LPS vs LPS + ST045849 group.
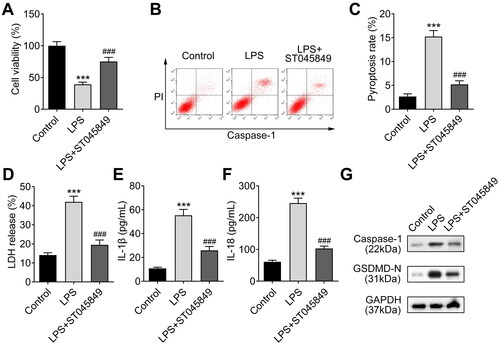
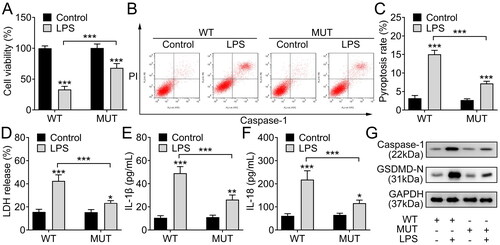
Figure 6. O-GlcNAcylation of NEK7 at S260 site promotes chondrocyte injury. A. The viability of LPS-induced chondrocytes with WT or S260 mutated NEK7 was measured by CCK-8 assay. B-C. The pyroptosis rate of LPS-induced chondrocytes with WT or S260 mutated NEK7 was analysed using flow cytometry. D. The LDH release condition of LPS-induced chondrocytes with WT or S260 mutated NEK7 was detected using LDH detection kit. E-F. The levels of IL-1β and IL-18 in LPS-induced chondrocytes with WT or S260 mutated NEK7 were measured through ELISA. G. The levels of pyroptosis-related proteins (Caspase-1 and GSDMD-N) in LPS-induced chondrocytes with WT or S260 mutated NEK7 were detected with western blot. ***P < 0.001: LPS + MUT group vs LPS + WT group.
Availability of data and materials
The datasets used and/or analysed during the current study are available from the corresponding author on reasonable request.