
Figures & data
Figure 1. (A) volcano plot, |Log2FC|≥0.107 and p < 0.05 were chosen as filtering conditions, scanned 264 upregulated genes and 202 downregulated genes. (B) Heatmap of top 50 different expressed genes.
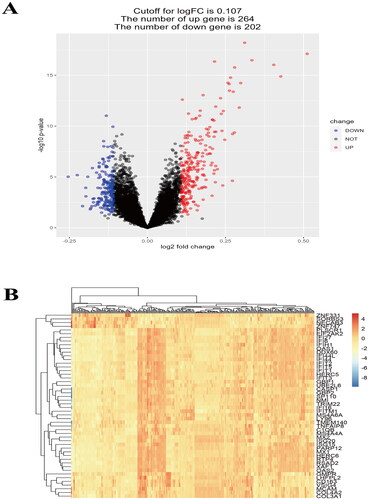
Figure 2. GO and DO enrichment analysis of DEGs. (A) BP enrichment analysis. (B) CC enrichment analysis. (C) MF analysis. (D) DO enrichment analysis.
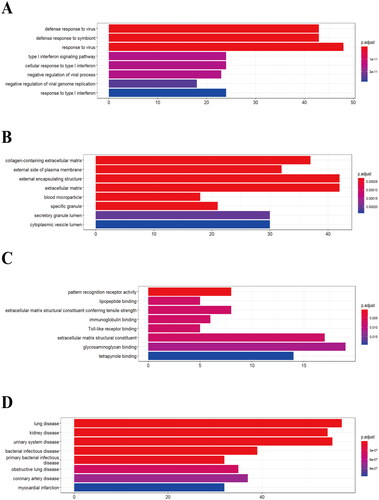
Figure 3. KEGG analysis of DEGs.
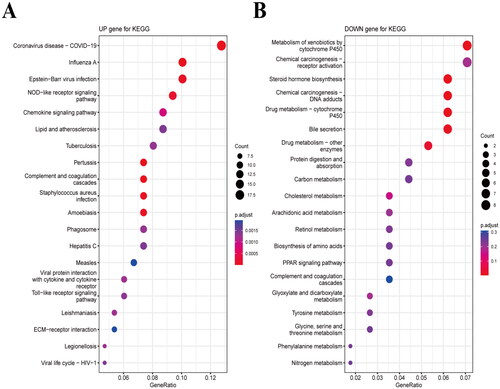
Figure 4. A. prediction performance of each machine learning model in training data and testing data, the models were arranged by average AUC in each dataset. B. PPI network of targeting genes.
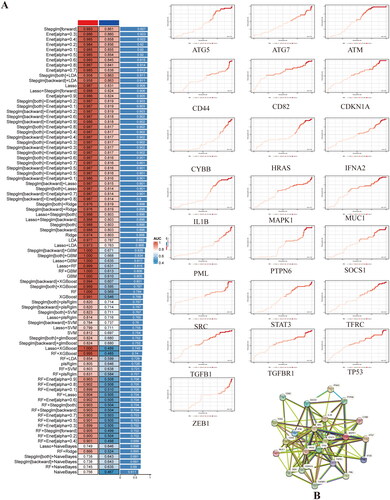
Figure 5. Correlation between targeting genes and clinical factors (proteinuria and serum creatinine (SCr).
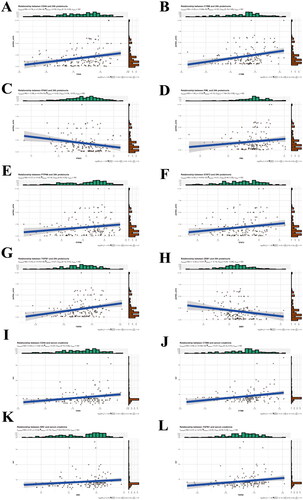
Figure 6. (A) Immune infiltrated cells composition in each sample. (B) immune infiltrated cells heatmap in different samples. (C) immune infiltered cell in different groups (lupus vs. control).
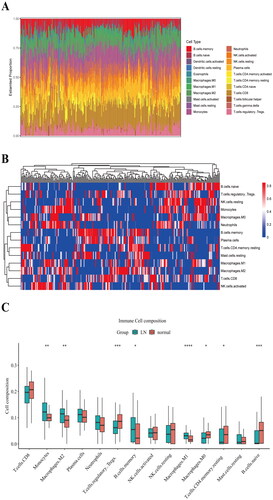
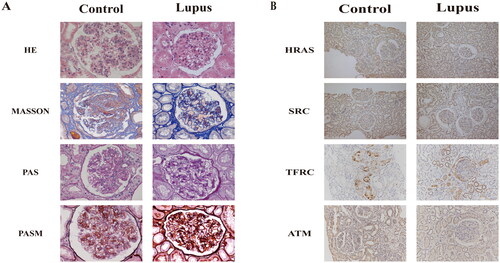
Figure 7. (A) HE, PAS, MASSON, PSAM staining of Lupus Nephritis and normal renal tissue. (B) Targeting gene expression in Lupus nephritis and normal renal tissue through immunohistochemical staining.
Supplemental Material
Download Zip (1.3 MB)Data availability statement
We can acquire the data from GEO Database (GSE32591, GSE127797, GSE69438, GSE99967, GSE113342 and GSE200306) and FerrDb database.