
Figures & data
Figure 1. Differences in the percentage of CXCR4+ B cells and the levels of CXCL12 between control and SLE subjects. A: The percentages (left panel) and absolute number (right panel) of CXCR4 + B cells in peripheral blood of MRL/lpr mice (n = 5) and C57 mice (n = 5) measured by flowmetry, and levels of CXCL12 in peripheral blood of MRL/lpr mice (n = 5) and C57 mice (n = 5) by ELISA. Gating scheme for CXCR4+ B cells that were identified as CD19 + CXCR4+. B: The percentages (left panel) and absolute number (right panel) of CXCR4+ B cells in bone marrow of MRL/lpr mice (n = 5)and C57 mice (n = 5)measured by flowmetry, and levels of CXCL12 in bone marrow of MRL/lpr mice (n = 5) and C57 mice (n = 5) measured by ELISA.Gating scheme for CXCR4+ B cells that were identified as B220 + CXCR4+. C: mRNA expression of CXCL12 in peripheral blood, bone marrow, spleen of MRL/lpr mice (n = 5) and C5 7 mice (n = 5) measured by qRT-PCR. D: The percentages of CXCR4+ B cells and expression of CXCL12 protein in peripheral blood of healthy controls (n = 5) and SLE (n = 10). E: The percentages of CXCR4+ B cells and expression of CXCL12 protein in bone marrow of healthy controls (n = 5) and SLE (n = 10). The last panel is the expression of CXCL12 between PB and BM of SLE (n = 5). Data represented the mean ± SD. *p < 0.05, **p < 0.01, ***p < 0.001, ****p < 0.0001, compared with C57BL/6 (A, B, C) and control(D, E).
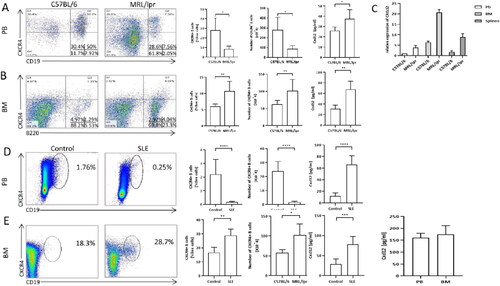
Figure 2. Expression of CXCL12 protein from mice OBs. A: Alkaline phosphatase staining before and after the implement of osteogenic medium. B: Expression of CXCL12 in BMMSCs and OBs from C57 and MRL/lpr mice (n = 5). C: The change of CXCL12 levels in the supernatant of the culture during osteogenic induction. CXCL12 levels were detected by ELISA at the beginning, 1 week (1 W) and 2 weeks (2 W) of induction. Data represented the mean ± SD. *p < 0.05, **p < 0.01, ***p < 0.001, ****p < 0.0001, compared with C57.
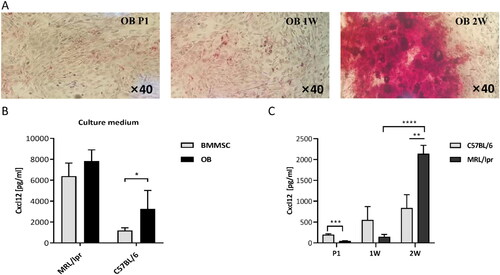
Figure 3. The number of transwell migration of B cells to OBs. A: shRNAefficiency was shown by qRT-PCR. shRNA effectively decreases supernatant concentration of CXCL12 in the OBs culture.(MPL/lpr + shRNA: MPL/lpr-derived OBs transinfected with shRNA by lentiviral vector). B: Transwell migration of splenic B cells (upper chamber) to OBs (lower chamber): C + C: C57/BL6 mice B cells (upper chamber) + C57/BL6 mice OBs (lower chamber); C + C + shRNA: C57/BL6 mice B cells (upper chamber) + C57/BL6 mice OBs transfected with shRNA (lower chamber); C + M: C57/BL6 mice B cells (upper chamber) + MRL/lpr mice OBs (lower chamber); C + M + shRNA:C57/BL6 mice B cells (upper chamber) + MRL/lpr mice OBs transfected with shRNA (lower chamber); M + C: MRL/lpr mice B cells (upper chamber) + C57/BL6 mice OBs (lower chamber); M + M: MRL/lpr mice B cells (upper chamber) + MRL/lpr mice OBs (lower chamber). C: Number of C57-derived splenic B cells migrated to MRL/lpr-derived OBs treated with CXCL12 antagonists (LIT-927) at different concentration. D: Number of MRL/lpr-derived splenic B cells migrated to MRL/lpr-derived OBs treated with LIT-927 at different concentration. Data represented the mean ± SD. *p < 0.05, **p < 0.01, ***p < 0.001.
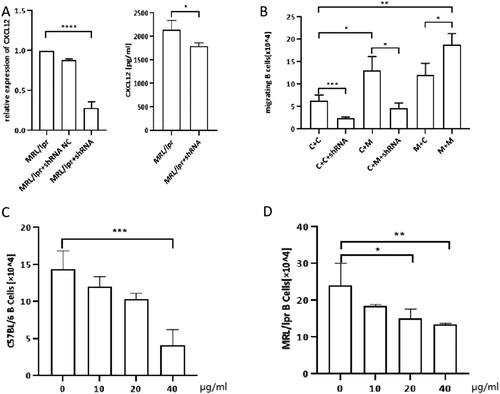
Figure 4. The number of CFDA-labeled CD19+ B cells were retro-orbitally injected into 12- to 13-week-old syngenic C57BL/6 (n = 5), MRL/lpr (n = 5) and LIT-927 treated MRL/lpr (n = 5), respectively. The percentage of CFDA-labelled B cells in the bone marrow was analyzed 24 h later post-injection by flow cytometry. Data represented the mean ± SD. **p < 0.01, ****p < 0.0001.
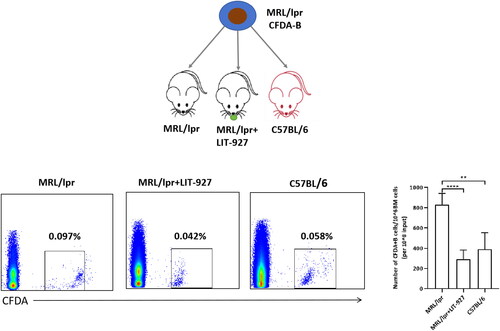
Figure 5. Representative image of C57 and MRL/lpr mice. Compared to C57mice, More B cells localize close to periosteal surface (A) and OB cells (B) where contains rich CXCL12 aggregates in MRL/lpr mice. Paraffin sections of mice femurs were assessed for the positivity and position of CXCL12, B cells (B220+ cells) and OB cells(CD31-CD51+)using immunofluorescence under confocal microscopy. The part in the box is magnified tenfold. Sections were counterstained with DAPI to visualize nuclei. A: Blue = DAPI, Red = B220, Green = CXCL12; B: Differences between the expression of CXCL12 between C57 and MRL/lpr BM have been analyzed by Image J. C: Pink = CD51, Green = CD31, Red = B220. Scale bar = 200 μm.
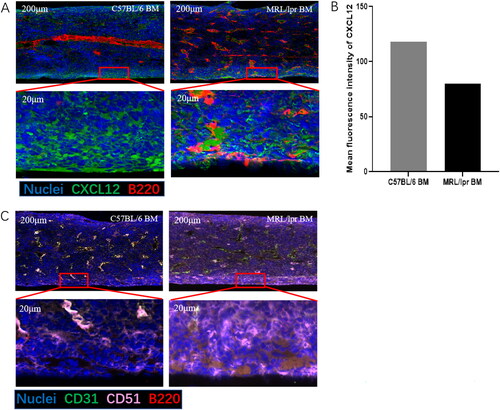
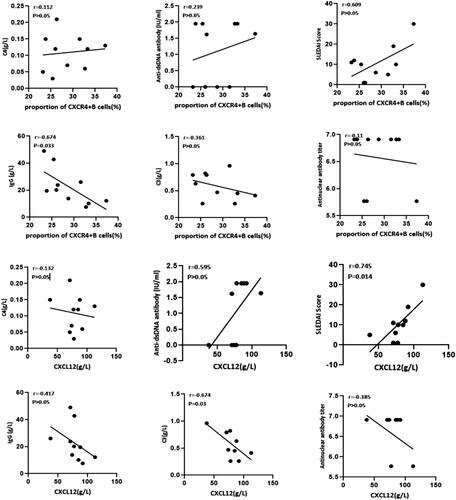
Figure 6. The correlation between markers of disease activity of SLE and the percentages of CXCR4+ B cells or the level of CXCL12 in bone marrow. The percentages of CXCR4+ B cells were negatively correlated with IgG concentration (r= −0.674, p < 0.05); The level of CXCL12 was positively correlated with SLEDAI Score (r = 0.745, p < 0.05) and negatively correlated with C3 concentration (r= −0.674, p < 0.05).
Supplemental Material
Download MS Word (40.9 KB)Data availability statement
The data (figures and table) used to support the findings of this study are included within the article.