
Figures & data
Figure 1. Experimental protocol, indices for systemic immunity and fertility, and placental gene expression associated with pregnancy.
(A) Experimental protocol. (B) Maternal spleen weight (SPW). (C) Maternal serum levels of anti-double-stranded (ds) DNA antibodies. (D) The uterus, placenta, and fetus of MRL/MpJ (MpJ) and MRL/MpJ-Faslpr/lpr (Lpr) mice. The uterus includes the placenta (orange arrowheads) and the fetus (blue arrowheads). The green arrowhead shows an absorption scar observed in the uterus. The right panel shows a placental remnant and an absorbed fetus in Lpr. Bars = 1 cm. (E) Number of implantations and fetuses. The number of implantations was defined as the total number of fetuses, abnormal fetuses, absorption scars, and placental remnants. (F) The ratio of the number of abnormal fetuses to the number of implants. (G) Placental and fetal weights. (H) Pregnancy-associated placental mRNA expression moMpJ: MRL/MpJ (MpJ) mother mated with Lpr father. moLpr: Lpr mother mated with MpJ father. Slc7a3: solute carrier family 7 (cationic amino acid transporter, y + system) member 3. Krt15: keratin 15. Sprr2a3: small proline-rich protein 2A1. Each bar represents the mean of each group. The number of animals or organs analyzed is summarized in . Significance for other strains at the same age and gestational day (GD) (Mann-Whitney U-test, *: P < 0.05, ** P < 0.01).
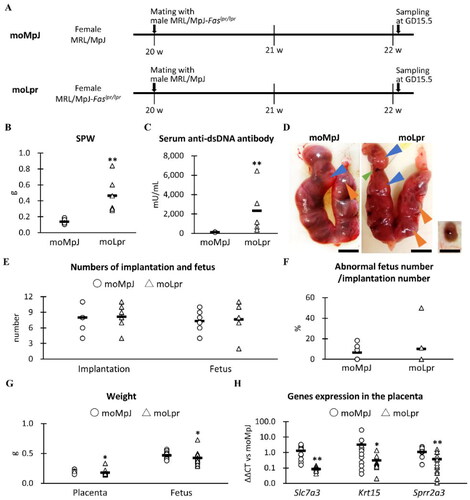
Table 1. The number of samples used in this study.
Table 2. The correlations between indices for maternal autoimmune disease and fertility.
Figure 2. Morphological analysis of the placenta.
(A) Placental histology with the labyrinth (Lb), junctional zone (Jz), and decidua (Dc) observed on the fetal side. Hematoxylin and eosin staining (HE). Bars = 100 μm. (B) Immunohistochemistry (IHC) of placental vimentin (vim). Lb and Dc were positive (+) for Vim but negative for Jz. Bars = 500 μm. (C) The ratio of each layer area to the total placental area. (D) The histology of each placental layer. Abundant maternal blood was observed (asterisk) in the Lb, which was surrounded by trophoblast cells (blue arrowheads). Several nucleated fetal red blood cells were also observed (orange arrowheads). In IHC for Vim, fetal vascular endothelial (Ve) cells were Vim+. In Jz, glycogen cells (asterisks), spongy trophoblast cells (orange arrowheads), and giant trophoblast cells (blue arrowheads) were observed; however, no Vim+ cells were observed. In Dc, abundant natural killer (NK) cells (black arrowheads) and decidual cells (orange arrowheads) were observed. In IHC, decidual cells (orange arrowheads) and maternal Ve were Vim+. HE stain and IHC. Bars = 100 μm. moMpJ: MRL/MpJ (MpJ) mice mated with MRL/MpJ-Faslpr/lpr (Lpr) mice. moLpr: Lpr mother mated with MpJ father. Each bar represents the mean of each group. The number of animals or organs analyzed is summarized in .
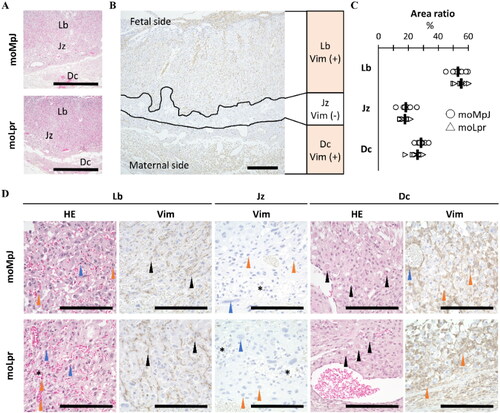
Figure 3. Immune cells observed in the placenta.
(A) Histological analysis of placental immune cells. In the decidua (Dc), natural killer (NK) cells contained eosinophilic granules (black arrowheads). Immunohistochemistry (IHC) revealed Gr-1-positive (+) neutrophils in the extravascular space and blood vessels of the Dc. B220+ B cells in blood vessels (black arrowheads), CD3+ T cells in the extravascular area (orange arrowheads), and blood vessels (blue arrowheads) in the labyrinth (Lb). Squares show high-magnification images of each positive cell. Hematoxylin and eosin staining. IHC. Bars = 100 μm. (B) The number of immune cells in the placenta. (C) The mRNA expression of genes associated with T cells. moMpJ: MRL/MpJ (MpJ) mice mated with MRL/MpJ-Faslpr/lpr (Lpr) mice. moLpr: Lpr mother mated with MpJ father. Th: T helper cells. Tc: T killer cells. Tfh: T follicular helper cells. Tregs: Regulatory T cells. Each bar represents the mean of each group. The number of animals or organs analyzed is summarized in . Significance for another strain at the same age and gestational age (Mann-Whitney U-test, *: P < 0.05, ** P < 0.01).
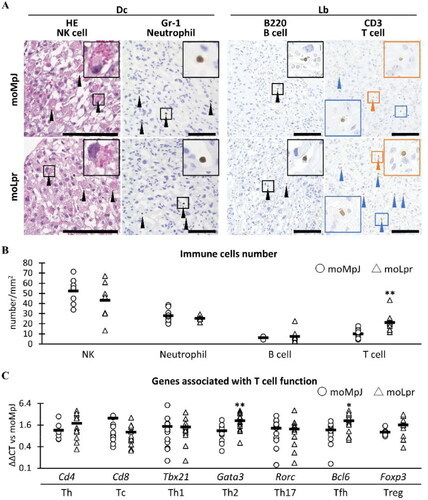
Figure 4. Placental gene expression and protein location associated with T cells.
mRNA expression associated with T cells in the placenta. (B) CCL5 localization in the moLpr placenta. (C) CXCL9 localization in the placenta. moMpJ: MpJ mother mated with Lpr father. moLpr: Lpr mother mated with MpJ father. ND: not detected. CCL5: C-C motif chemokine 5. CXCL9: Chemokine (C-X-C motif) ligand 9. Each bar represents the mean of each group. The number of animals or organs analyzed is summarized in Table 1. Significance for another strain at the same age and gestational age (Mann-Whitney U-test, *: P < 0.05, ** P < 0.01).
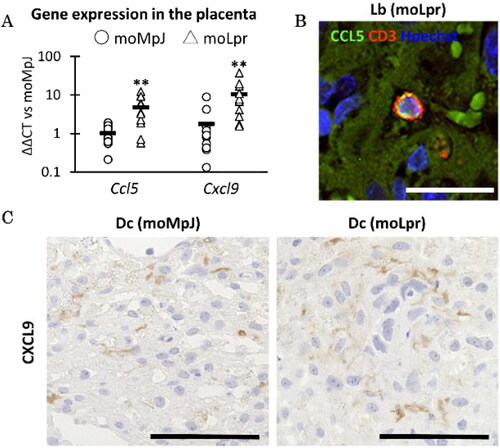
Table 3. The correlations among indices for autoimmune disease, fertility, immune cell quantities, and T cell.
Supplemental Material
Download Zip (390.1 KB)Data availability statement
The data supporting the findings of this study are available from the corresponding author upon request.