
Figures & data
Figure 1. The overall flowchart of this study. ADs, autoimmune diseases; pQTL, protein quantitative trait loci; GWAS, genome-wide association studies; MR, Mendelian randomization; PPH4, posterior probability of hypothesis 4.
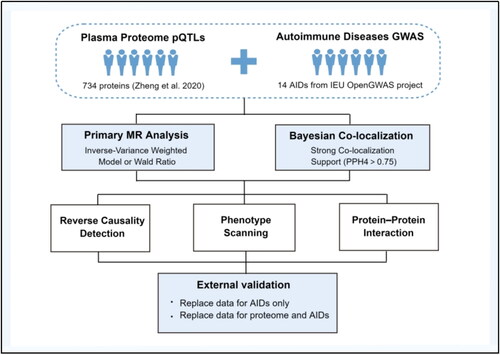
Figure 2. Forest plot of the primary MR analysis. ADs, autoimmune diseases; AS, ankylosing spondylitis; SLE, systemic lupus erythematosus; UC, ulcerative colitis; CD, Crohn’s disease; RA, rheumatoid arthritis; T1D, type 1 diabetes.
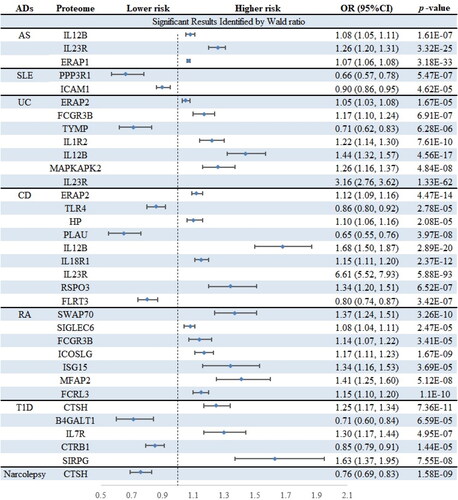
Figure 3. Volcano plots of primary MR analysis. A, B, C, D, E, F, and G show primary MR with Wald ratio method on circulating proteins on the risk of ADs. OR for increased risk of ADs were expressed as per SD increase in circulating protein levels. The black horizontal dashed line represents the filtering threshold for Bonferroni correction. ln = natural logarithm; PVE = proportion of variance explained.
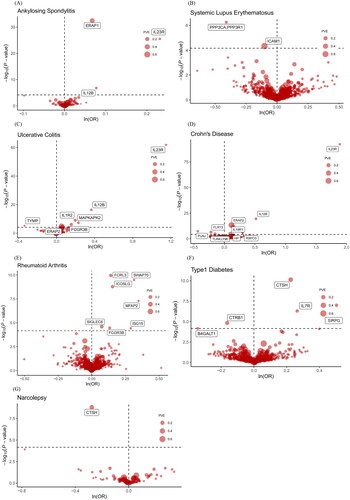
Table 1. Results of primary MR analysis after bonferroni correction.
Table 2. Summary of reverse MR analysis, steiger filting, and Bayesian co-localization analysis.
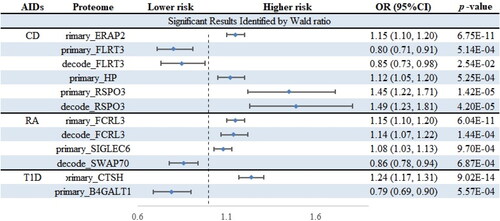
Figure 4. Forest plot of the external validation. ADs, autoimmune diseases; CD, Crohn’s disease; RA, rheumatoid arthritis; T1D, type 1 diabetes. ‘primary_’ means replacing only the data of ADs, while ‘decode_’ means replacing the data of both plasma proteome and ADs.
Supplemental Material
Download Zip (9.8 MB)Data availability statement
Summary statistics of ADs can be downloaded from IEU consortium (https://gwas.mrcieu.ac.uk/) and the GWAS ID was presented in Supplementary Table 1. The pQTL statistics of plasma proteome are publicly available on the Decode database (https://download.decode.is/form/folder/proteomics).
Further inquiries can be directed to the corresponding author.