Figures & data
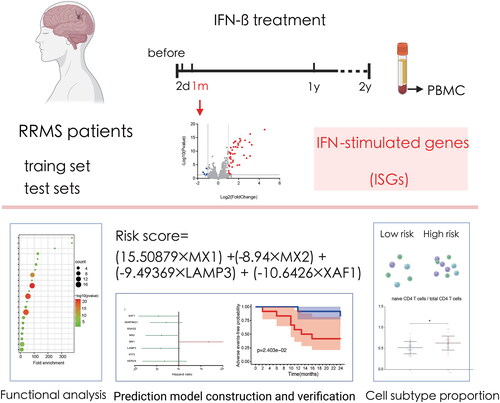
Figure 1. Flowchart of the development of an IFN- responsiveness prediction model based on the mRNA expression level of RRMS patients’peripheral blood mononuclear cells. DEGs, differential expressed genes.
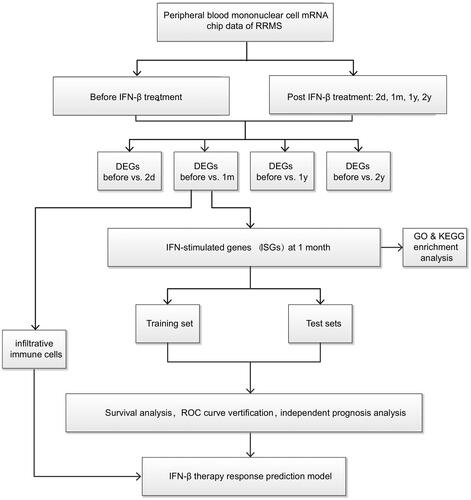
Figure 2. Gene expression at different time points in RRMS patients’ peripheral blood mononuclear cells following IFN- treatment in the training set. Volcano maps and PCA showed that several genes altered significantly in patients at one month of treatment.
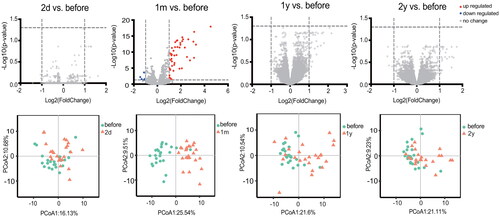
Figure 3. Protein-protein interaction network and functional analysis of ISGs detected at one month after the onset of IFN- therapy. (a) The network of interactions among the ISG proteins. Each node represents a protein. Disconnected nodes are not shown. (b) GO functional (biological process and molecular function) and KEGG signalling pathway enrichment analysis of ISGs. The bubble size and colour correlate with the number of ISGs and the significance of the p-value, respectively.
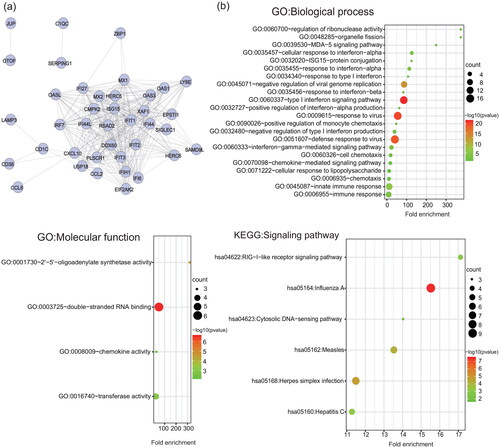
Figure 4. The expression level of ISGs associated with the prognosis of RRMS patients. (a) Single-factor Cox regression analysis. (b) Multifactor Cox regression analyses. The four ISGs obtained by constructing the prognostic model shown in the forest map, red indicates high-risk gene and green denotes low-risk genes.
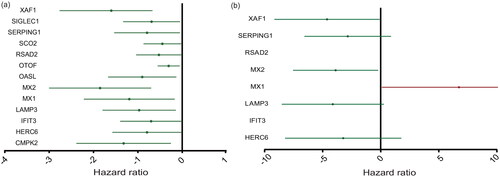
Figure 5. Adverse events-free survival analysis and verification of IFN- treatment response prediction model. (a) The risk score and adverse events-free status distribution of training set (GSE24427) and test sets (GSE19285 and GSE33464). (b) Adverse events-free survival analysis curves of patients in the high- and low-risk group in training set and test sets. (c) ROC curves of the predictive performance for exacerbation and progression within 2 years of the responsiveness prediction model of training set and test sets.
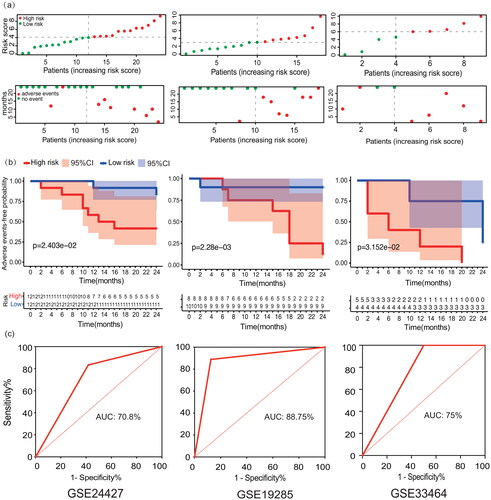
Figure 6. Single-factor (a) and multifactor (b) prognostic analyses of other demographic or clinical data of the patients.
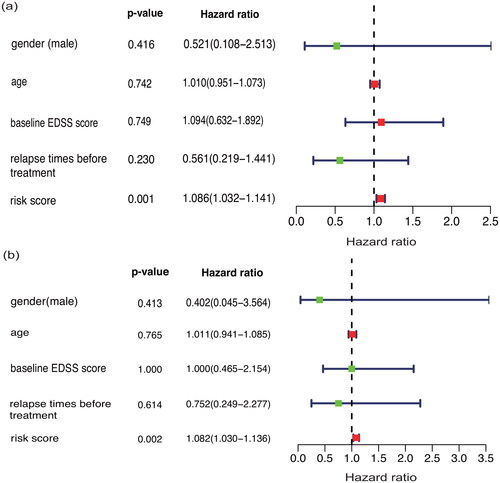
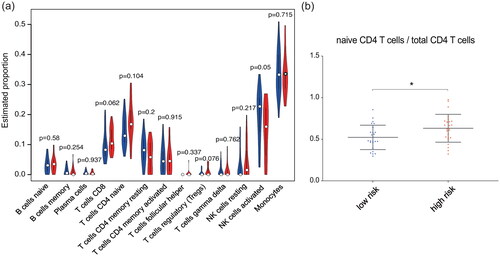
Figure 7. Correlations between the IFN- response score and proportions of mononuclear cell subtypes. (a) Violin plot of the abundances of mononuclear subtypes between the high-risk (blue) and low-risk (red) groups. (b) The abundances of naive CD4 T cells in the total CD4 T cell population between the high- and low-risk groups.