
Figures & data
Table 1. Clinical data of thymoma and thymic hyperplaisa patients.
Figure 1. Analysis of the developmental stages of MG (+) versus MG (−) thymomas. (A) Representative flow cytometry contour plots and heatmaps showing the gating strategy used to analyze thymocytes from type B thymomas and the stage distribution of each patient (n = 15). (B) The percentage of thymocytes at the indicated developmental stages in MG (+) thymomas (n = 8) and MG (−) thymomas (n = 7). The data are shown as the means ± SDs. Statistical significance was determined by using Student’s t test for B.
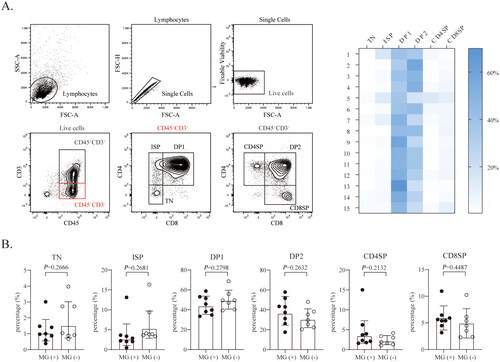
Figure 2. Proportion of Thpok+ CD4SP cells is higher in MG (+) thymomas. (A) The percentages of CD45RA+ cells in the CD4SP or CD8SP population in MG (+) thymomas (n = 8) and MG (−) thymomas (n = 7). (B) The MFI of the αβ TCR in CD45RA+ and CD45RA− thymocytes in the CD4SP and CD8SP stages (n = 14) (data on the αβ TCR of patient #9 were lost due to a technical error). (C) The expression of the αβ TCR in CD4SP and CD8SP thymocytes in MG (+) thymomas (n = 7) and MG (−) thymomas (n = 7). (D) Correlation between the levels of αβ TCR and Thpok expression in CD4SP cells (n = 13) (r = 0.7224, p = .0053) (data from patient #1 was lost due to a technical error). (E) The percentages of Thpok+CD4SP cells among CD4SP cells in MG (+) thymomas (n = 7) and MG (−) thymomas(n = 6). The data are shown as the means ± SDs. Statistical significance was determined by using Student’s t test for A, B, C, and E. *p < .05, **p < .01, ***p <.001.
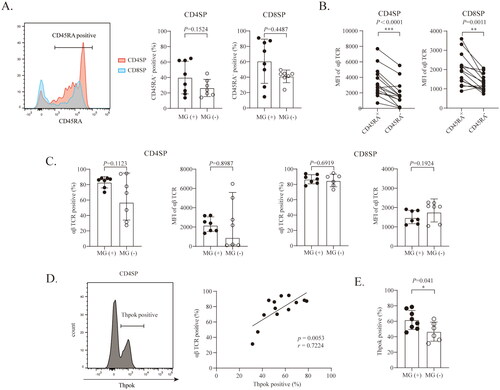
Figure 3. DP cells from MG (+) thymomas display opposite αβ TCR and IL-7Rα expression patterns to those from MG (−) thymomas. (A) The expression of αβ TCR thymocytes in the indicated developmental stages in type B thymomas. (B) The expression of the αβ TCR in DP2 thymocytes in MG (+) thymomas (n = 7) and MG (−) thymomas (n = 7). (C) The expression of the αβ TCR in R-DP2 and CD4+CD8INT thymocytes in MG (+) thymomas (n = 7) and MG (−) thymomas (n = 7). (D) The expression of IL-7Rα in thymocytes at the indicated developmental stages from type B thymomas (n = 13). (E) The MFI of IL-7Rα in R-DP2 and CD4+CD8INT thymocytes in MG (+) thymomas (n = 6) (the IL7Rα data of patient #9 and #10 were lost due to a technical error) and MG (−) thymomas (n = 7). (F) The immunoreactivity of IL-7 in type B thymomas was calculated as the average IOD. The statistical diagram shows the expression of IL-7 in MG (+) (n = 4) and MG (−) (n = 5) thymomas. (G) The percentage of Helios+ CD4SP cells in MG (+) thymomas (n = 7) and MG (−) thymomas (n = 7). The data are shown as the means ± SDs. Statistical significance was determined by using Student’s t test. *p < .05. **p<.01.
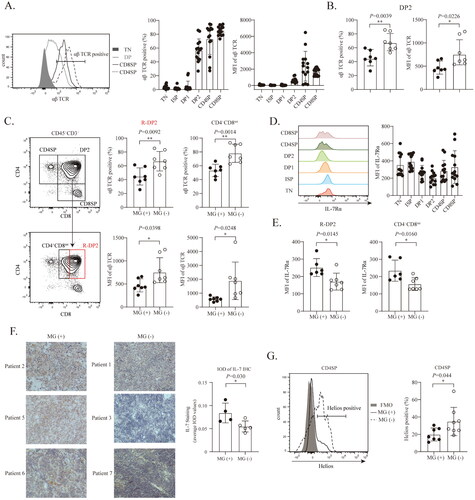
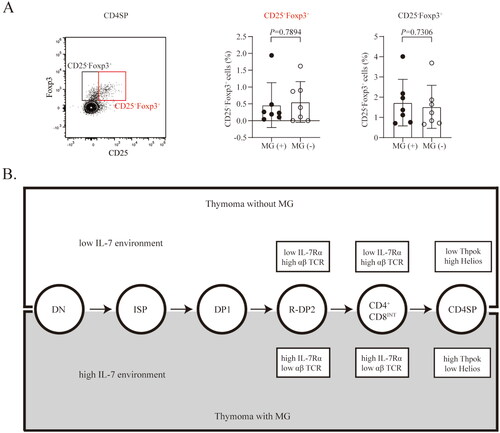
Figure 4. The proportion of intratumoral CD25+Foxp3+CD4+ T cells did not differ between MG (+) and MG (−) thymomas. (A) The percentage of CD25-Foxp3+ and CD25-Foxp3+ CD4SP cells in MG (+) (n = 7) and MG (−) (n = 7) thymomas. The data are shown as the means ± SDs. Statistical significance was determined by using Student’s t test. (B) Schematic depicting the different environments and phenotypes of thymocytes in MG (+) and MG (−) thymomas.
Data availability statement
All data are available in the main text.