
Figures & data
Figure 1. Network pharmacological analysis of key active ingredients in Yinchenhao decoction.
The treatment of AIH compound frequency ratio statistics pie chart (A). Blue represents Yinchenhao decoction (16%), orange represents Chaihu Shugan Powder (12%), gray represents Xiaoyao Powder (12%), and yellow represents All-Along Decoction (9%). Single drug cluster dendrogram for AIH (B). Cluster analysis by SPSS, the abscissa for drug use frequency, ordinate for drug name, among them, the red fonts are artemisia capillaris, gardenia and rhubarb, respectively. The three drugs were grouped into one type, and the combined use frequency was 24 times. Venn diagram of YCHD and AIH candidate targets (C). The blue part is the target of AIH, the gray part is the target of YCHD, and the 171 intersections are potential targets of YCHD in the treatment of AIH. Network diagram of “active ingredient-target” of YCHD (D). The blue color refers to 171 putative targets of YCHD for the treatment of AIH. The yellow color represents the ingredient of artemisia capillaris, the orange color represents the ingredient of Gardenia, and the green color represents the ingredient of rhubarb. The gray circle represents β-sitosterol, which is a common component of artemisia capillaris, gardenia, and rhubarb.
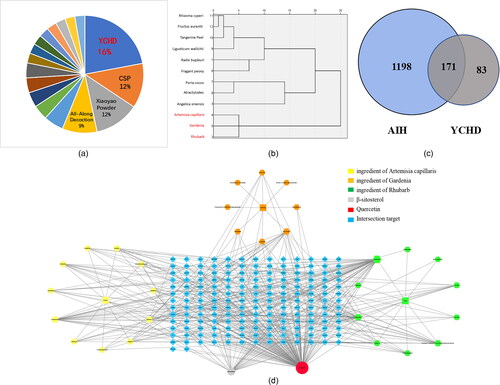
Figure 2. Selection of concentration and time of Con A and quercetin.
Different concentrations of Con A-FITC (0, 10, 20, 40, 80 μg/ml) were incubated with J774A.1 cells for 12 h. With the increase in Con A concentration, the MFI of Con A expression gradually increased (A). Bar chart shows the median fluorescence intensity of Con A expression on J774A.1 cells after loading different concentrations of Con A (B), results quantified by flow cytometry. With the prolongation of Con A (6, 12, and 24 h), the percentage of Con A positive gradually increased, and the percentage of Con A positive cells basically reached saturation when Con A was treated for 12 h (C). Bar chart shows the percentage of Con A positive in J774A.1 cells at different time points post adding Con A into J774A.1 cells (D), results quantified by flow cytometry. Figure E shows the line plots of Brl3a cell activity at different quercetin concentrations, with red, green and black lines representing 12 h, 24 h and 48 h. *, P < 0.05; **, P < 0.01.
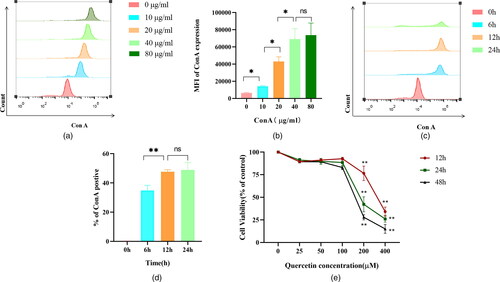
Figure 3. Quercetin reduces Con A-induced hepatocyte damage and levels of cytokines.
Quercetin mitigated Con A-induced hepatocyte damage in Brl3a. Figures A, B, and C represent the expression levels of ALT, AST and NO, respectively. IL-1β production was divided into three groups (Control, Con A, and Con A + quercetin), flow cytometry was used to detect it, and the negative control group was used to gate it. The more the peak shape of the single parameter histogram shifted to the right, the stronger the fluorescence intensity was (D), and the data on IL-1β were expressed as the mean fluorescence intensity (E). To increase the confidence of the results, the cytokine IL-1β was also detected by ELISA (F). Data are expressed as mean ± SEM. *P < 0.05, **P < 0.01, ***P < 0.001.
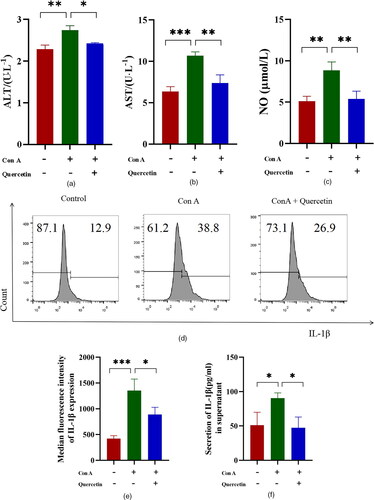
Figure 4. Quercetin inhibits hepatocyte apoptosis induced by Con A.
The effect of quercetin on the Con A-induced Caspases 3, 8, and 9 signaling pathway was determined by western blotting. The experiments were repeated at least three times, the difference was statistically significant (A, B and C). The apoptotic of Brl3a cells using annexin-V staining of tested cancer cell lines. Dots represent cells as follows: lower left quadrant, normal cells (FITC−/PI−); lower right quadrant, early apoptotic cells (FITC+/PI−); upper left quadrant, necrotic cells (FITC−/PI+); upper right quadrant, late apoptotic cells (FITC+/PI+). Con A significantly induced apoptosis in hepatocytes, whereas quercetin attenuated this change (D). The apoptosis rate was expressed as the sum of early and late apoptosis rates (E). The ratio of PE (red) J-aggregates and FITC (green) J-monomers is used to represent the mitochondrial membrane potential. The higher the proportion of green, the higher the apoptosis rate, and the lower the red/green ratio, the lower the mitochondrial membrane potential (F). The scale bar is 100 μm in the lower right corner of the image. The result showed that aggregates/monomers MFI decreased significantly in Con A group, and the expression level of JC-1 increased after quercetin treatment (G). Data are expressed as mean ± SD. *P < 0.05, **P < 0.01, ***P < 0.001.
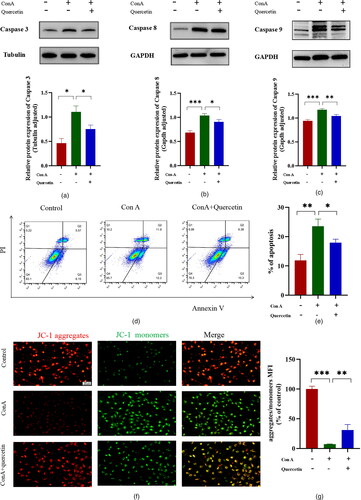
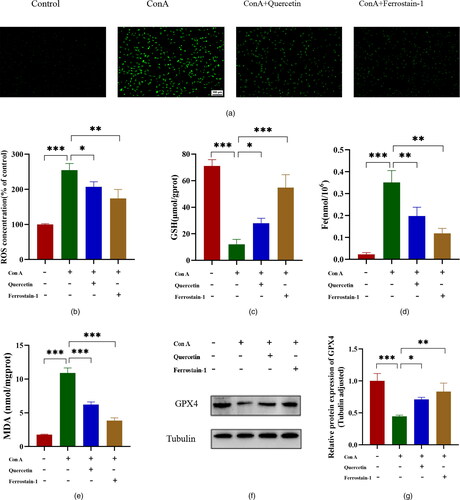
Figure 5. Quercetin inhibits hepatocyte ferroptosis induced by Con A.
Representative images of immunofluorescence staining for ROS (green) in Brl3a cells (A). The scale bar is 100 μm in the lower right corner of the image. The quantitative analysis of ROS was detected by a fluorescent enzyme labelling instrument, and the results showed that ROS content increased in the Con A group and decreased after quercetin or ferrostain-1 treatment (B). Those levels of (C) GSH, (D) Fe and (E) MDA in Brl3a, as detected using Elisa assay kits. Western blot showing protein expression of GPX4 in the control, Con A, Con A + quercetin and Con A + Ferrostatin-1 groups. Tubulin was used as a loading control (F, G). The data shown are the mean ± SD. *P < 0.05, **P < 0.01, ***P < 0.001.
Data availability statement
The data that supports the findings of this study is available from the corresponding author upon reasonable request.