Figures & data
Figure 1. Illustration of triangle and four-cycle network motifs characterizing fit.
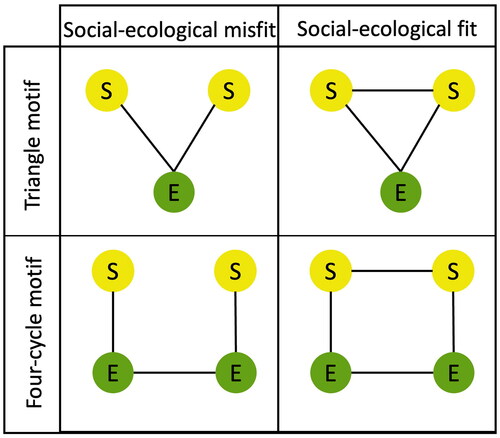
Table 1. Assessments of governance outcomes by actors and associated share of open network motifs.
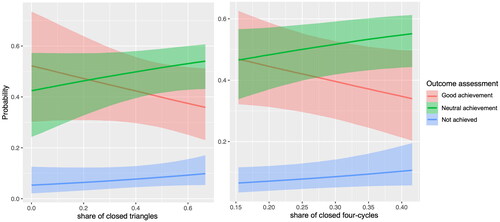
Figure 2. Marginal effects of the share of the closed triangle and four-cycle motifs on governance outcomes assessments. The probabilities of all three states of governance outcomes sum to one for every configuration of inputs. To interpret the figure, the likelihood of the state of a governance outcome falling within the highest versus the lowest category with an increasing share of closed versus open motifs of fit can be compared. Solid lines within ribbons show the median posterior density. Ribbons indicate the 88% credibility interval. The range of the x-axis differs for the share of closed triangles and four-cycle motifs as it is based on the empirically observed range.