
Figures & data
Figure 1. Flow chart depicting the patient selection process.
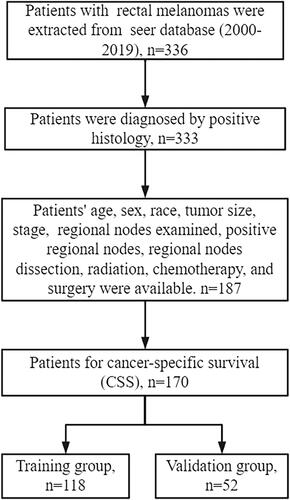
Table 1. Characteristics of patients with rectal melanoma diagnosed from 2000 to 2019 obtained from the SEER database.
Figure 2. Kaplan-Meier (KM) survival curves comparing the overall survival (OS) of patients with rectal melanomas (RM). (A) patients’ age; (B) tumor stage; (C) regional nodes examined; (D) surgery.
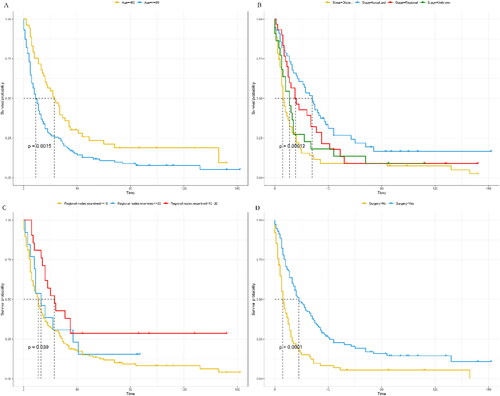
Figure 3. Kaplan-Meier (KM) survival curves comparing the cancer-specific survival (CSS) of patients with rectal melanomas (RM). (A) patients’ age; (B) tumor stage; (C) regional nodes examined; (D) surgery.
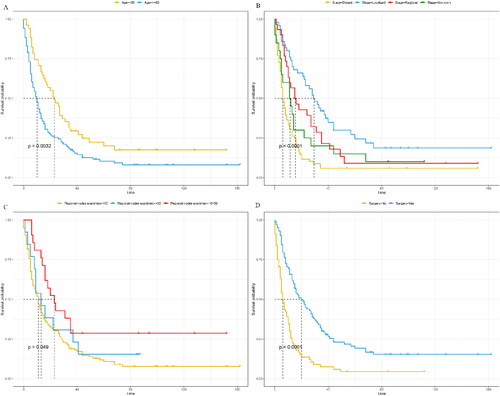
Figure 4. Forest plot for multivariable Cox regression analysis of the cancer-specific survival (CSS) in patients with rectal melanomas (training group).
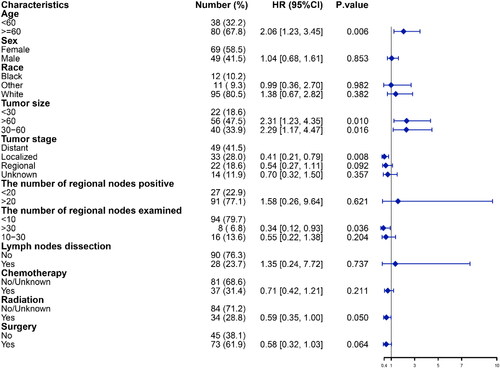
Figure 5. A prognostic nomogram predicting the cancer-specific survival (CSS) of patients with rectal melanomas for the 12, 24, and 36 months (training group).
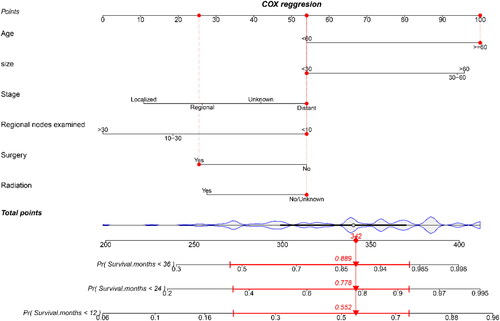
Table 2. Baseline clinical characteristics of patients diagnosed with rectal melanoma in training and validation groups.
Figure 6. Time-dependent receiver operating characteristic (ROC) curves of cancer-specific survival (CSS) for the 12, 24, and 36 months in the training (A) and validation (B) groups in patients with rectal melanomas.
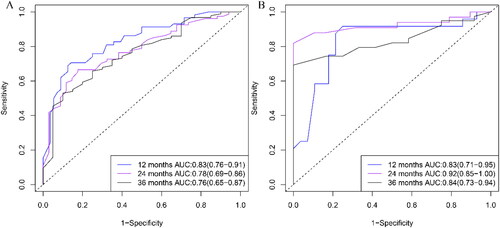
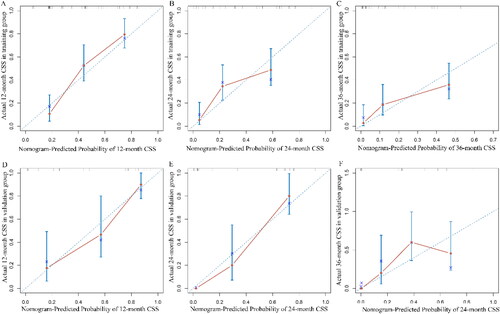
Figure 7. Calibration plots of 12-, 24-, and 36-month cancer-specific survival (CSS) for patients with rectal melanomas in the training (A-C) and validation (D-F) groups.
Availability of data and materials
Publicly available datasets were analyzed in this study. This data can be found here: Surveillance, Epidemiology, and End Results (SEER) database (https://seer.cancer.gov/).