Figures & data
TABLE 1 Environmentally-controlled room setting and smoking conditionsa
FIG. 1 Layout of the environmentally controlled room, seating for occupants, and location of online and offline sampling equipment.
TABLE 2 Indoor air constituents measured onlinea
TABLE 3 Indoor air constituents measured offlinea
TABLE 4 Mean concentrations of indoor air constituents (“office” with “high” IAQ conditions)
TABLE 5 Mean concentrations of indoor air constituents (“office” with “medium” IAQ conditions)
TABLE 6 Mean concentrations of indoor air constituents (“office” with “low” IAQ conditions)
TABLE 7 Mean concentrations of indoor air constituents (“hospitality” with “low” IAQ conditions)
FIG. 2 Percent difference between smoking CC (Simulation 5) and smoking CC (Simulation 1) in the concentration of indoor air constituents in the “office” with a “high” IAQ condition.
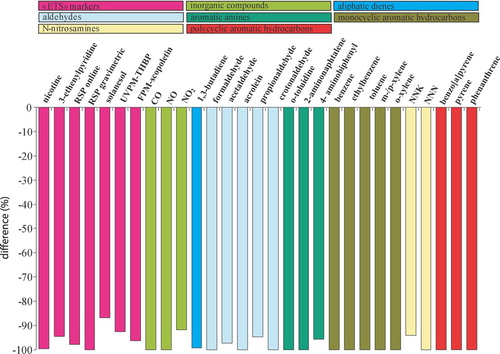
FIG. 3 Percent difference between smoking CC (Simulation 8) and smoking CC (Simulation 4) in the concentration of indoor air constituents in the “hospitality” environment with a “low” IAQ condition.
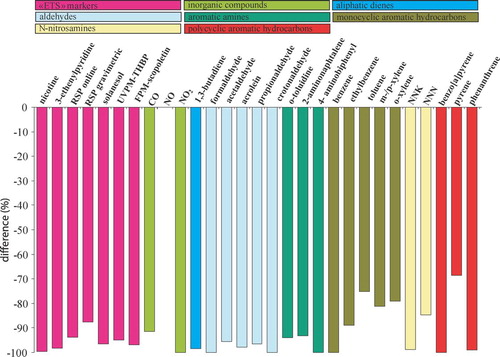
FIG. 4 Ratio of indoor air constituent concentrations (background corrected) of particulate phase markers CC/EHCSS for all simulations. For the “office” with “high” IAQ conditions the background was greater than in the EHCSS smoking session (simulation 1); therefore, a ratio could not be calculated.
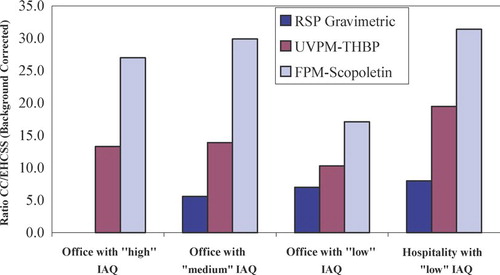
FIG. 5 Cumulative distribution of indoor air nicotine concentrations in European restaurants. The curve to the right (•) is derived from literature (Schorp & Leyden, Citation2002). The curve to the left (▴) is the hypothetical nicotine distribution curve if smoking of CC was replaced by smoking of an EHCSS.
FIG. 6 Cumulative distribution of indoor air particulate-phase ETS-RSP in restaurants in France, Japan, Korea, the United Kingdom, the United States, and Switzerland. The curve to the right (•) is derived from literature (Bohanon et al., Citation2003). The curve to the left (▴) is the hypothetical ETS-RSP curve if smoking of CC was replaced by smoking of an EHCSS.