Figures & data
Figure 1. Visualization of the digital geometry (left) and the complete segmented cast model of human airways (right). Reproduced from Belka et al. (Citation2014) with kind permission of The European Physical Journal (EPJ).
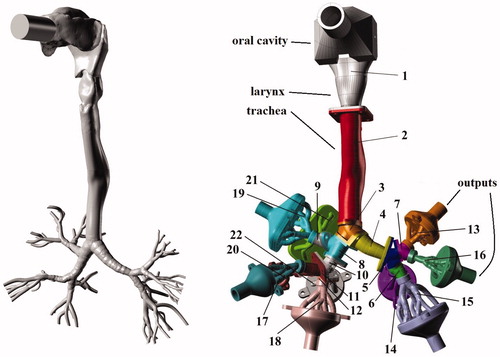
Table 1. Internal surface area Ai and equivalent diameter De,i of the airway segments of the lung cast.
Figure 2. (a) Monodisperse glycerol and (b) multicomponent aerosol droplet size distributions, where da is the aerodynamic diameter and the error bars represent the SD (i.e. variability over the duration of a representative experiment).
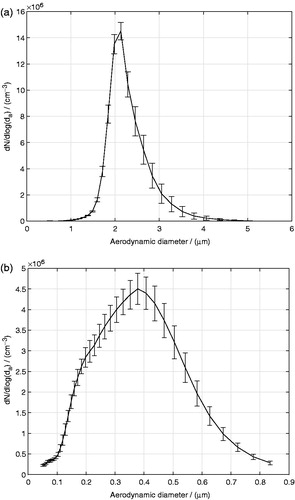
Figure 3. Schematic of the experimental set-up.
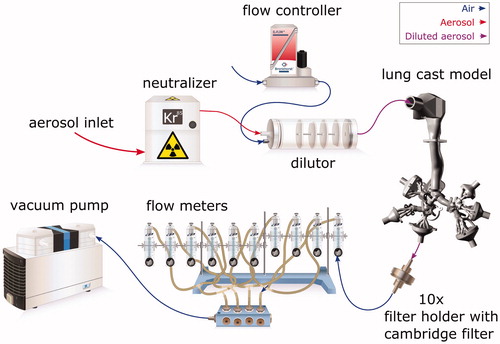
Table 2. Flow rates for each airway segment of the lung cast for the monodisperse glycerol aerosol and multicomponent aerosol experiments.
Table 3. Dimensionless numbers for each single generation segment of the lung cast for the monodisperse glycerol aerosol experiments.
Figure 4. Mass deposition rate, , of glycerol (α = glycerol) (a) per cast segments (i = 1,…,22), and (b) the deposition surface density rate per segment,
for the monodisperse glycerol aerosol experiments.
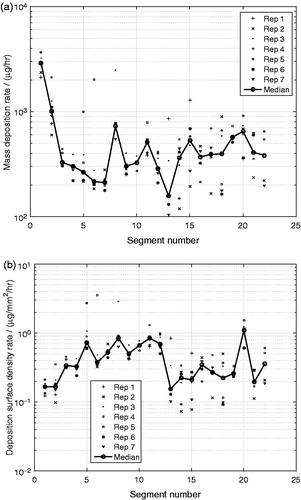
Figure 5. Mass deposition rate, , of glycerol (α = glycerol) per output connector segments (i = 23,…,32), in which the deposited mass extracted from the attached filter holders and filters were added for the monodisperse glycerol aerosol experiments.
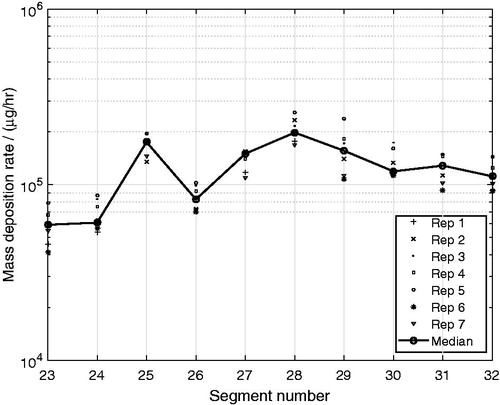
Figure 6. Deposition efficiency, ξα,i, for the oral cavity, the trachea (G0) and the segments representing generations G1–G4 as a function of the local Stokes number for the monodisperse glycerol aerosol experiments (α = glycerol). Symbols of different colors represent data from different sources: the present study (black), Zhou & Cheng (Citation2005) (white), Chan & Lippmann (Citation1980) (light gray) and Lizal et al. (Citation2015) (dark gray). The only exception is the white symbols for the oral segment representing the data extracted from Cheng et al. (Citation1999).
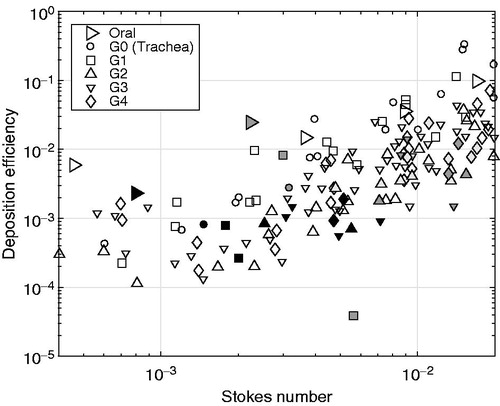
Figure 7. Mass deposition rate per segment, , of (a) glycerol, (b) propylene glycol and (c) nicotine from exposure with a multicomponent aerosol.
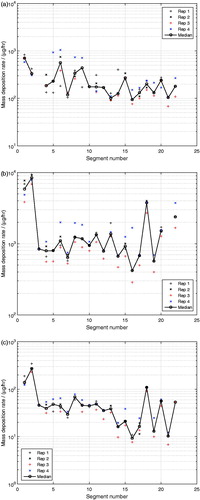
Figure 8. Mass deposition rate, , of glycerol, propylene glycol and nicotine per output connector segments (i = 23,…,32), in which the deposited mass extracted from the attached filter holders and filters were added for the multicomponent aerosol experiments.
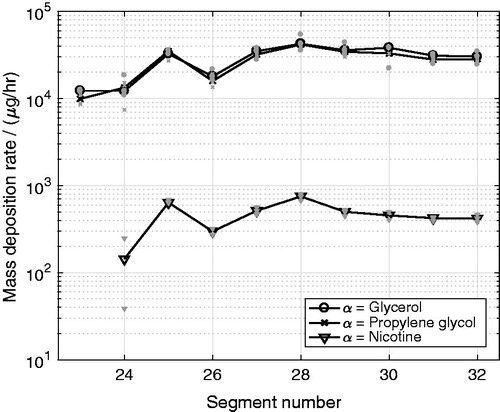
Figure 9. Deposition surface density rate per segment, , of (a) glycerol, (b) propylene glycol and (c) nicotine from exposure with a multicomponent aerosol.
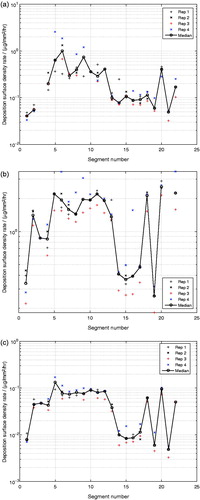
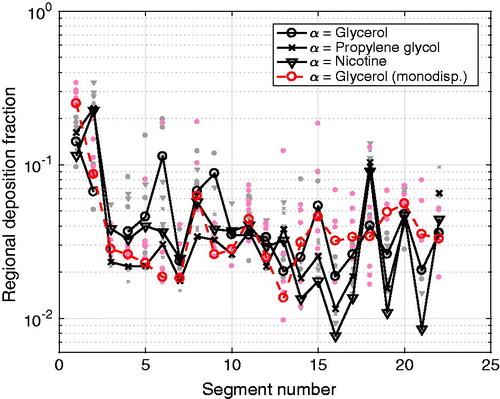
Figure 10. Regional deposition fraction per segment, RDFα,i, for glycerol, propylene glycol and nicotine for the multicomponent aerosol (black) and the monodisperse glycerol aerosol (red). The individual gray and light red symbols represent the individual experimental points, whereas the symbols connected by a line represent the median values for the respective compound.