
Figures & data
Table 1. Overview of all attributes employed in the study.
Table 2. Number of dwellings removed at every step in the data cleaning process.
Table 3. Sale year distribution of dwellings in Oslo, Bergen, and Trondheim.
Figure 1. Square meter price distribution for dwellings in Oslo.
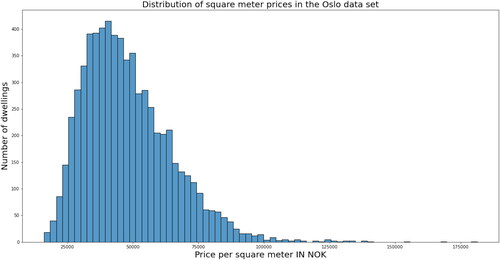
Figure 2. Distribution of bathroom condition scores in Oslo.
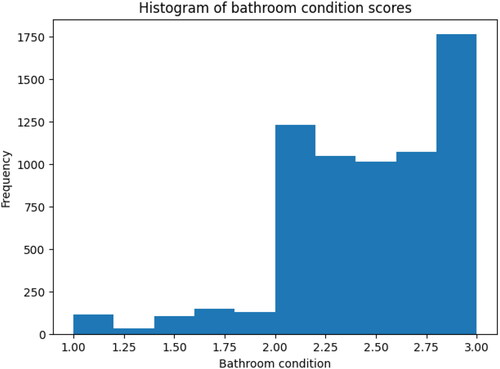
Table 4. Descriptive statistics for numerical attributes in Oslo.
Figure 3. Heatmap displaying correlation between condition attributes and selected noncondition attributes, including the target variable. A number close to 1, or a dark green color, indicates high positive correlation, and a number close to –1, or a light color, indicates high negative correlation.
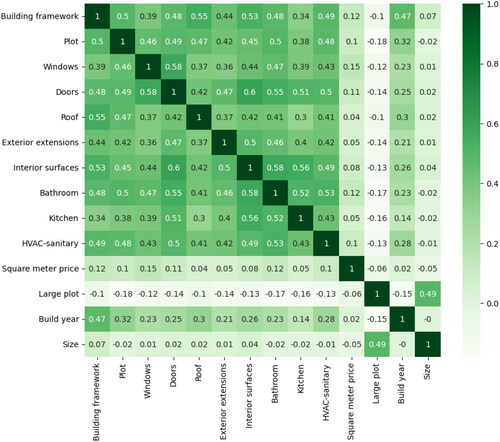
Table 5. Test set performance for the linear regression (LR), XGBoost and SVM models with and without condition for dwellings in Oslo, Bergen, and Trondheim.
Table 6. Linear regression coefficients for condition attributes in Oslo, Bergen, and Trondheim.
Figure 4. XGBoost and SVM model interpretation plots in Oslo. (a) and (c) illustrate the relative importance of the attributes, with larger bars indicating higher importance. (b) and (d) illustrate the identified relationship between price and the condition attributes. The SHAP value represents the estimated impact on the square meter price in NOK. For each attribute, the dots represent a dwelling in the data set. The color of the dot indicates the condition of that attribute, with more blue dots indicating worse condition. Clustering of blue dots to the left and red dots to the right indicates a positive relationship, i.e., a better condition results in a higher price.
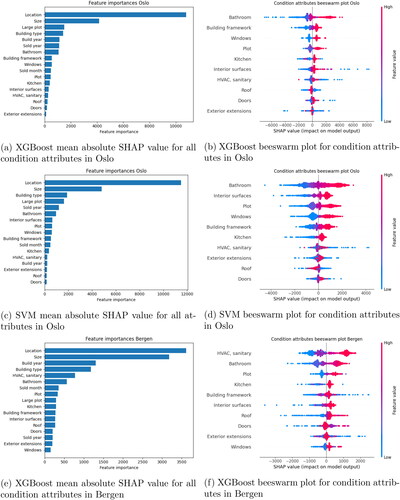
Figure 5. Relationship between price and bathroom and building framework condition attributes. Each dot represents a training example. The x-axis holds the value of the condition attribute for that training example, with worse conditions to the left. The y-axis holds the SHAP value, which is the estimated impact on the square meter price in NOK. The dots are colored according to binary variables to illustrate interaction effects.
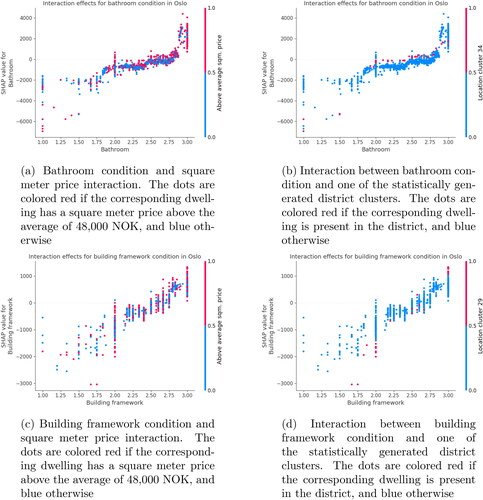
Table A1. Descriptive statistics for numerical attributes in Bergen.
Table A2. Descriptive statistics for numerical attributes in Trondheim.
Figure B1. Oslo and Viken county, with the main area of study highlighted. The city of Oslo is marked in black. The numbering of the municipalities is as follows: 1. Oslo, 2. Lørenskog, 3. Bærum, 4. Lillestrøm, 5. Asker, 6. Drammen.
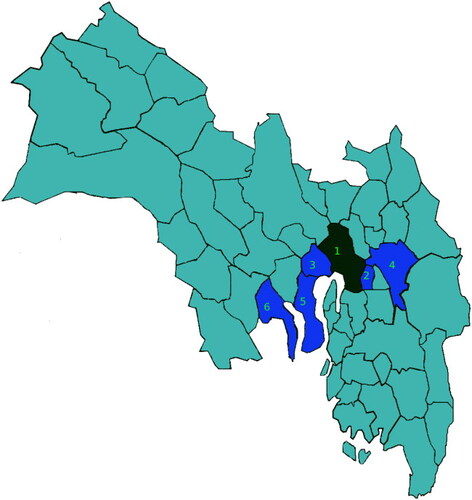
Figure B2. Map of boroughs in Oslo, color-coded according to average dwelling square meter price. Square meter prices are retrieved from Oslo municipality fact database (Oslo Municipality, Citation2021). No price information was provided for the center of Oslo, colored in blue. Red color indicates higher prices, green color indicates lower prices. The prices range from around NOK 43,000 to NOK 90,000.
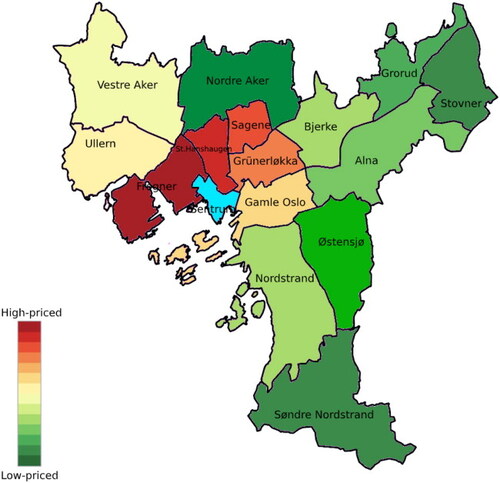
Figure B3. Map of boroughs in Trondheim, color-coded according to average dwelling square meter price. Prices range from around NOK 34,000 to NOK 51,000 and are for the last quarter of 2020. Prices are retrieved from Krogsveen (Citation2021).
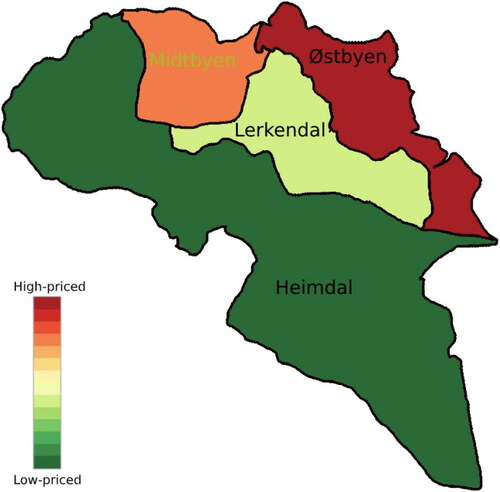
Figure B4. Map of boroughs in Bergen, color-coded according to average dwelling square meter price. Prices range from around NOK 30,000 to NOK 50,000 and are for 2020. Prices are retrieved from Marschhäuser (Citation2021).
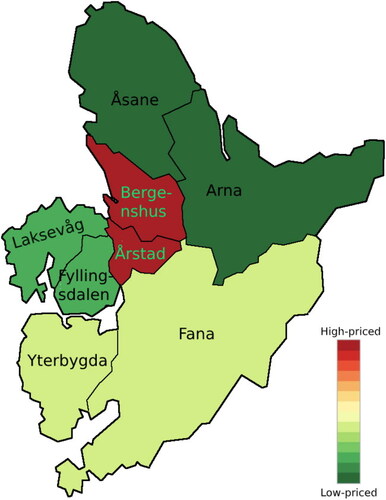
Table C1. Full regression results for Oslo.