
Figures & data
Table 1. Representative of the data.
Figure 1. Northern District of Georgia. Notes: This figure shows the cities in the Northern District of Georgia (NDGA), where we have fee-exemption access to personal bankruptcy data. The district includes four cities: Atlanta, Rome, Newnan, and Gainesville. The gray area denotes the middle and southern districts of Georgia.
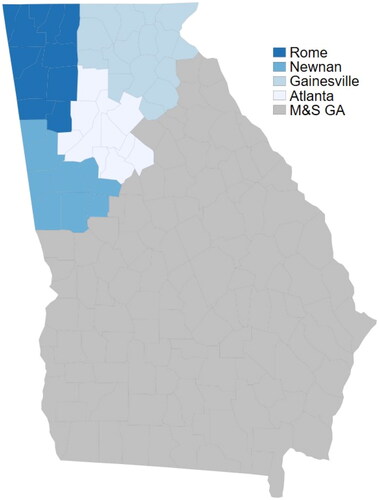
Figure 2. Linkage among three datasets. Notes: The figure shows the data linkage among three datasets: GAMLS listing data, personal bankruptcy filing data and ZTRAX data. First, we merge the GAMLS listing data to bankruptcy files by taking advantage of Member data. We call this merged dataset GAMLS-member-bankruptcy data, which is used for our main regression. Second, we also merge the GAMLS listing data with the transaction data from ZTRAX based on sale price, sold date, and address of the property. The matched dataset is called GAMLS-ZTRAX data, which is used for identifying which home sellers’ houses are represented by financially distressed brokers. Third, we match seller name and buyer name within ZTRAX data to track the home sellers’ purchase activity following Buchak et al. (Citation2020).
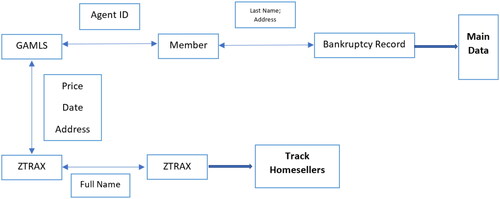
Table 2. Summary statistics.
Table 3. Impact of personal financial distress on sales price.
Figure 3. Dynamics of the impact on sale price. Notes: The figure shows the coefficient plot from a DID regression (along with 95% confidence intervals). The dependent variable is ln(Sales Price). The variable we are interested in is lead/lags of if(Distress). Year 0 indicates the exact year when the real estate agent filed for bankruptcy, year-1 indicates the year prior to the bankruptcy filing, year -2 indicates two years before the filing date, etc.
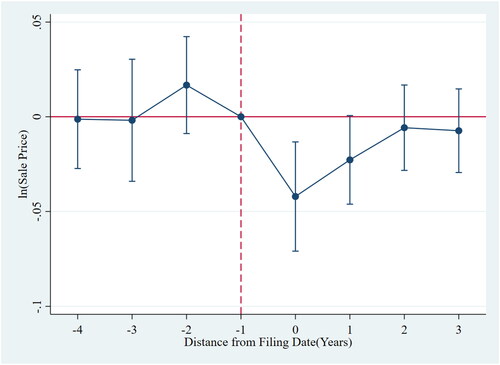
Table 4. Explanation of the results.
Figure 4. Dynamics of the impact on listing price. Notes: The figure shows the coefficient plot from a DID regression (along with 95% confidence intervals). The dependent variable is ln(Listing Price). The variable we are interested in is lead/lags of if(Distress). Year 0 indicates the exact year when the real estate agent filed for bankruptcy, year-1 indicates the year prior to the bankruptcy filing, year-2 indicates two years before the filing date, etc.
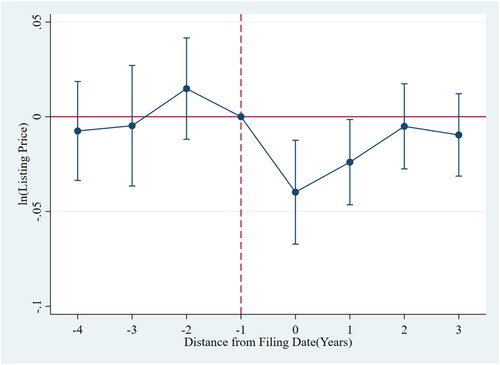
Figure 5. Dynamics of the impact on TOM. Notes: The figure shows the coefficient plot from a DID regression (along with 95% confidence intervals). The dependent variable is ln(Time on Market). The variable we are interested in is lead/lags of if(Distress). Year 0 indicates the exact year when the real estate agent filed for bankruptcy, year-1 indicates the year prior to the bankruptcy filing, year-2 indicates two years before the filing date, etc.
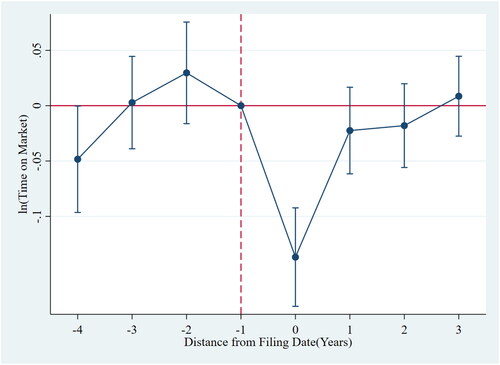
Table 5. Robustness tests.
Table 6. Additional tests.
Table 7. Heterogeneity test.
Table 8. Spillover effect.
Figure A1. The number of real agent bankruptcy filings and total filings in NDGA. Notes: This figure shows the number of filing cases of real estate agents and total the number of filings in Northern District of Georgia (NDGA). The left y-axis is for total the number of filings in NDGA, while the right y-axis is for the number of agents’ filing in our sample.
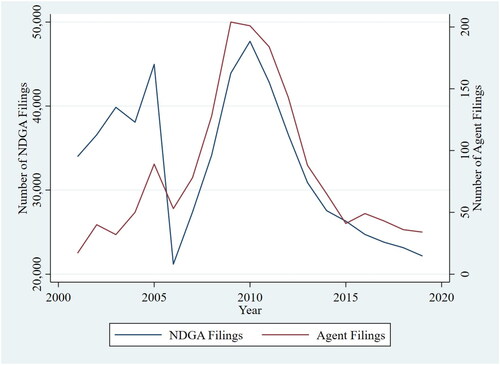
Figure A2. Difference of the housing characteristics before and after matching. Notes: The figure shows the difference of the housing characteristics between two groups of owners, i.e., the previous houses represented by distressed agents versus non-distressed agents, before and after PSM matching.
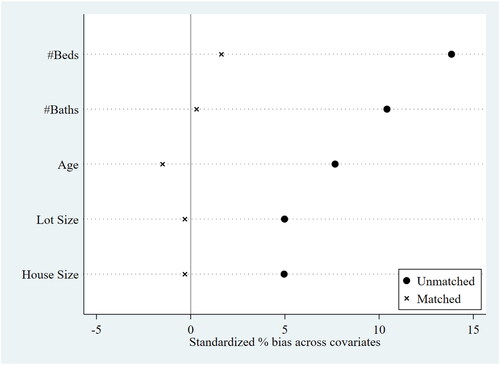
Table A1. Definition of variables.
Table A2. Additional test of the impact on sale price.
Table A3. Robustness test of impact on sale price.
Table A4. Impact of personal financial distress on other outcomes.