
Figures & data
Figure 1. IL-3, IL-3R, IL-5 and GM-CSF expression by human breast cancer subtypes.
(A) Swimmer plots representing gene expression of IL3+IL3RA+CSF2RB combined in breast cancer patients as a whole or separated into the molecular subtypes (luminal A, luminal B, HER2 enriched or basal-like) with number of patients, hazard ratio (HR) and the log-rank p value calculated by Cox-regression analysis; p < 0.05 considered significant. (B) Kaplan-Meier plots of the luminal A (Lum A, n = 1678), or basal-like subtype (n = 714) of breast cancer patients for gene expression of either IL3RA+CSF2RB, IL3, IL5 or CSF2 with high (blue) versus low (red) based on median expression levels, with HR and log-rank p value calculated by Cox-regression analysis; p < 0.05 considered significant. (C) Representative IHC analysis of IgG1 isotype control or antibodies targeting IL-3, IL-3Rα, IL-3Rβ, GM-CSF or IL-5 protein expression by human TNBC tumor tissue. DAB staining (brown) and hematoxylin counterstain (blue). White scale bar = 100µm. Yellow scale bar = 50µm.
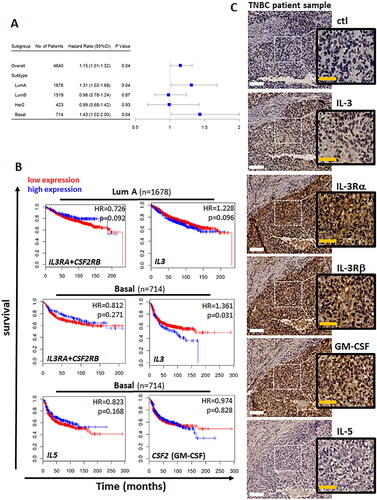
Figure 2. Human TNBC TMAs – IL-3/IL-3R IHC scores –T1-T4, primary and metastases.
(A) Representative IHC of IL-3, IL-3Rα and IL-3Rβ protein expression by human TNBC TMA (#BR1201) across patients grouped in T1-4. DAB staining (brown) and hematoxylin counterstain (blue). Staining intensity scored for IL-3 (blue), IL-3Rα (black) or IL-3Rβ (green) with results shown as scores averaged from two cores for each of the 43 different tumor samples (T1 n = 3, T2 n = 32, T3 n = 3, T4 n = 5) mean ± sem with statistical analysis using one way ANOVA with multiple comparisons and p < 0.05 considered significant. White scale bar = 100µm. (B) TMA (#BR1001e) staining intensity scored for IL-3 (blue), IL-3Rα (black) or IL-3Rβ (green) for patient matched primary (open symbols) or metastasis sections (closed symbols). Results shown as scores averaged from two cores for each of the 12 different patient samples that are linked by a solid line from the patient primary to metastatic tumor. A paired t-test was performed for the patient matched primary and metastatic lesions with p < 0.05 considered significant.
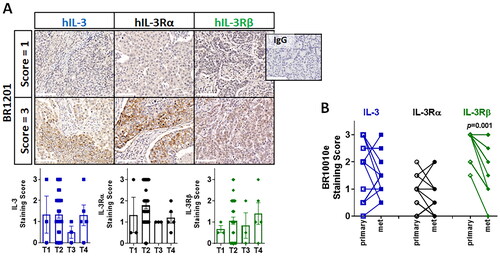
Figure 3. Human TNBC PDXs – IL-3/IL-3R IHC scores – primary and metastasis.
Representative IHC of IL-3, IL-3Rα and IL-3Rβ protein expression by human TNBC PDXs. DAB staining (brown) and hematoxylin counterstain (blue). Staining intensity scored for primary (n = 13 tumors, open shapes) or residual disease/metastasis sections (n = 11 tumors, closed shapes) with results shown as individual scores for the 24 different tumors. A two-tailed Mann-Whitney test compared the primary and residual/metastatic lesions with p < 0.05 considered significant. Yellow scale bar = 50µm.
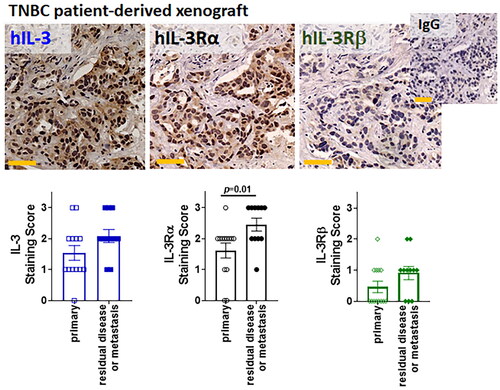
Figure 4. Human breast tissue (benign, DCIS and IDC) – IL-3/IL-3R IHC scores – ducts, stroma, tumor tissue.
Staining intensity scored for IL-3 (blue), IL-3Rα (black) or IL-3Rβ (green) with results shown for ducts, stroma and tumor in benign breast tissue (n = 8, closed circles), DCIS (n = 18, closed squares) and IDC (n = 17, closed triangles). Results shown as individual sample scores with mean ± sem. Statistical analysis using one way ANOVA with multiple comparisons with p < 0.05 considered significant. N/A = not applicable.
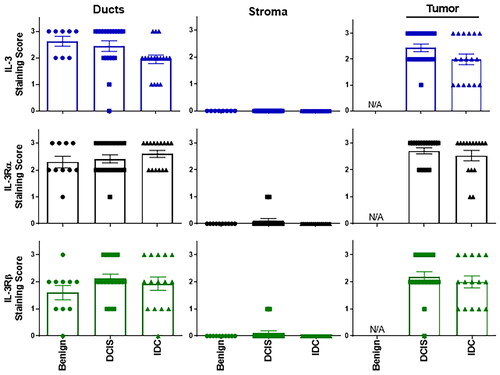
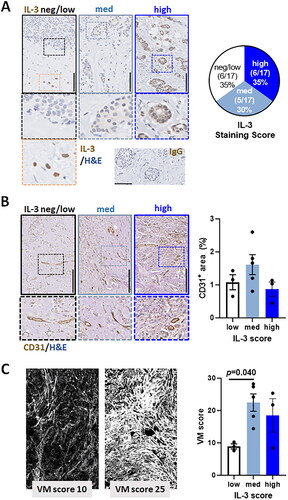
Figure 5. Human IDC sections, IL-3 staining intensity and tumor vasculature.
(A) Representative IHC analysis of IL-3 protein expression by human IDC tumor tissue scored as blinded samples within an arbitrary 0–3 for negative-high DAB stain (brown) intensity with hematoxylin counterstain (blue). Black scale bar = 250µm. Right pie chart is the cumulative % scores for the neg/low, medium and high staining intensity of the 17 patient samples. Orange framed insert shows IL-3-positive T cells and bottom right is the isotype control staining. (B) Representative IHC analysis of CD31 staining of tumor vasculature in the aforementioned human IDC tumor samples previously scored 0-3 for negative-high IL-3 expression. Black scale bar = 250µm. The bar graph shows ImageJ quantified % CD31+ area detected across the 11 patient samples and grouped for IL-3 expression levels (white bar = neg/low (n = 3); light blue bar = medium (n = 5) and dark blue bar = high IL-3 (n = 3)). High magnification images illustrate CD31+ endothelial cells. (C) Representative PAS-stained fluorescence images of the aforementioned human IDC tumor samples previously scored 0–3 for negative-high IL-3 expression. The bar graph shows ImageJ quantified mean VM score for n = 11 patient samples grouped for IL-3 expression levels (white bar = neg/low (n = 3); light blue bar = medium (n = 5) and dark blue bar = high IL-3 (n = 3)). Statistical analysis using one way ANOVA with multiple comparisons, p < 0.05 considered significant.
Supplemental Material
Download PDF (542.2 KB)Data availability statement
Data sharing is not applicable to this article as no new data were created or analyzed in this study.