Figures & data
Table 1. Chemical composition of the maize silage and concentrate mixtures.
Table 2. Voluntary intake and total digestibility in heifers fed diets with different forage-to-concentrate ratios.
Figure 1. Residual and between animals relative standard deviations and intraclass correlation (correlation between measures within animals taken on different collection days) in heifers fed diets with different forage-to-concentrate ratios. (a) – urinary excretion and urinary concentrations of creatinine and chromium; (b) – urinary creatinine excretion and urinary chromium recovery.
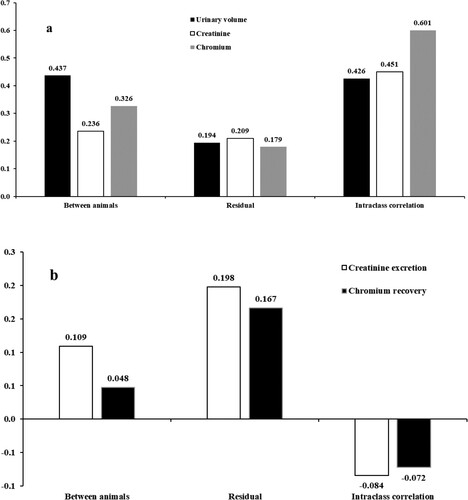
Table 3. Total urinary volume and urinary concentrations of creatinine and chromium in heifers fed diets with different forage-to-concentrate ratios according to the collection days.
Table 4. Pearson correlations between urine volume and urinary creatinine and chromium concentrations in heifers fed diets with different forage-to-concentrate ratios.
Table 5. Creatinine excretion and urinary chromium recovery in heifers fed diets with different forage-to-concentrate ratios according to the collection days.
Table 6. Urinary concentrations of creatinine and chromium in heifers fed diets with different forage-to-concentrate ratios according to the time of urine collection (spot samples).
Table 7. Serum and plasma chromium concentrations in heifers fed diets with different forage-to-concentrate ratios according to blood collection times.
Figure 2. Relationship between predicted and observed values of urinary volumes in heifers fed diets with different forage-to-concentrate ratios [the continuous lines represent the equality (Y = X); the dashed lines represent least square straight lines. Data were adjusted for the random effects of animals and experimental periods. For details on the adjusted equations, please see . (a), creatinine; (b), chromium.
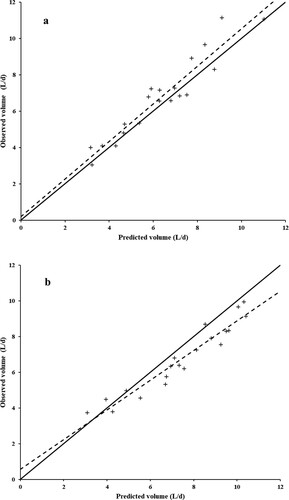
Table 8. Evaluation statistics of the estimated values of urinary volume (L/d) from spot samples in heifers fed diets with different roughage concentrate ratios as a function of the creatinine and chromium markers.
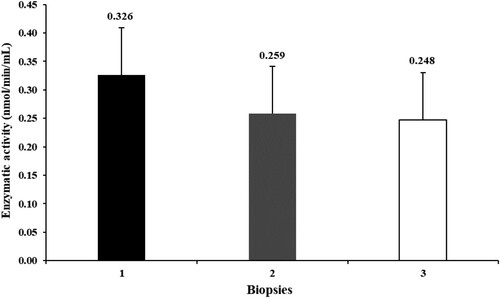
Figure 3. Activity of the α-ketoglutarate dehydrogenase in the liver of heifers fed diets with different forage-to-concentrate ratios in different biopsies during the experiment (1, beginning of the experiment; 2, end of the first experimental period; 3, end of the second experimental period; P = 0.76).