Figures & data
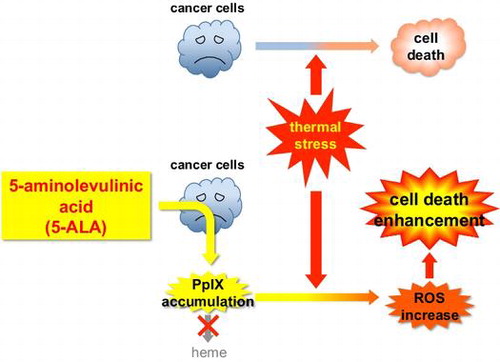
Fig. 1. 5-ALA enhances cell death of certain cancer cell lines but not normal cell lines under thermal stress.
Notes: Cells were grown with indicated concentrations of 5-ALA at 37 (open bars) and 42 °C (closed bars) for 24 h and counted for cell death by trypan blue staining. (A) Human transformed cell line HEK293 and cancer cell lines HepG2, Caco-2, and KATO III. (B) Human cancer cell lines HT1080, U2-OS, MCF7, and A431. (C) Normal human cell lines WI-38, MRC5, and mouse NIH3T3 cells. Bars represent mean ± SEM (n = 3–5). Brackets: *p < 0.05; **p < 0.01.
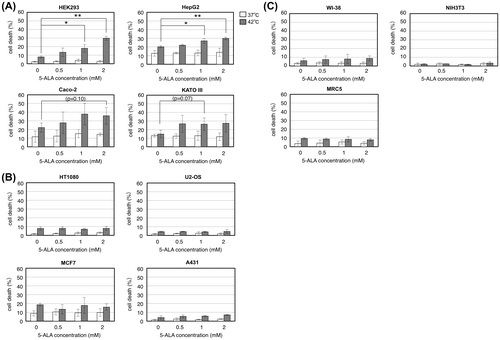
Fig. 2. Effect of 5-ALA on intracellular PpIX accumulation.
Notes: Cells were grown with indicated concentrations of 5-ALA at 37 (open bars) and 42 °C (closed bars) for 24 h and the cell lysates were subjected to HPLC analysis of intracellular PpIX amount (pmol/104 cells). (A) Human transformed cell line HEK293 and cancer cell lines HepG2, Caco-2, and KATO III. (B) Human cancer cell line U2-OS and normal human cell line WI-38. Bars represent mean ± SEM (n = 3–5).
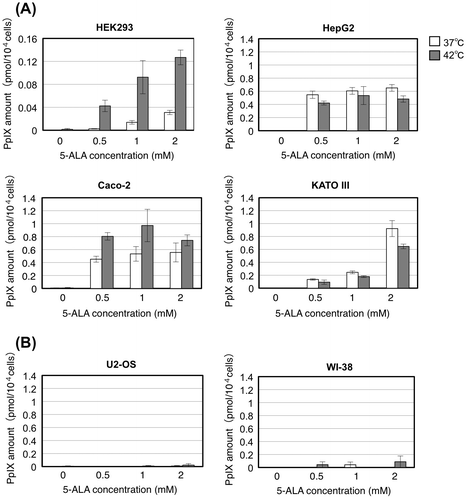
Fig. 3. PpIX directly enhances cell death of certain cancer cell lines under thermal stress.
Notes: Human transformed cell line HEK293 and cancer cell lines HepG2, Caco-2, and KATO III (A, C) or human cancer cell line U2-OS and normal human cell line WI-38 (B, D) were grown with indicated concentrations of PpIX or 2 mM 5-ALA at 37 (open bars) and 42 °C (closed bars) for 24 h and counted for cell death by trypan blue staining (A, B) or the cell lysates were subjected to HPLC analysis of intracellular PpIX amount (C, D). Bars represent mean ± SEM (n = 3–5). Brackets: *p < 0.05; **p < 0.01.
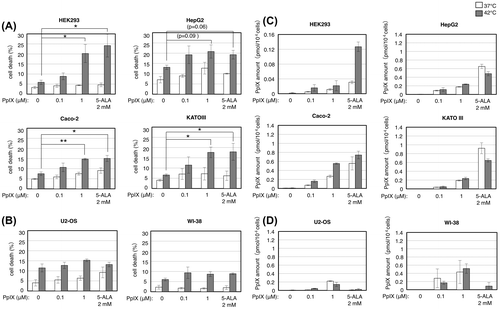
Fig. 4. Effect of 5-ALA on ferrochelatase, frataxin and ABCG2 expression under thermal stress.
Notes: Cells were grown with indicated concentrations of 5-ALA at 37 and 42 °C for 24 h and the cell lysates were subjected to western analysis using antibodies against ferrochelatase (FeCh) (A), frataxin (B), and ABCG2 (C). α-tubulin expression was analyzed in all the experiments as internal control.
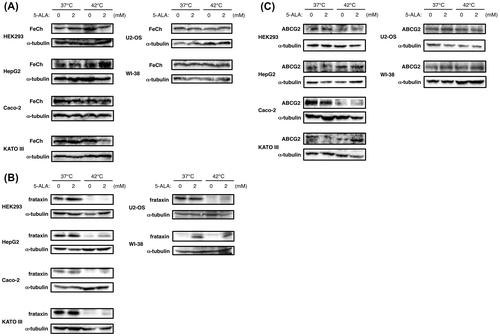
Fig. 5. Blocking ABCG2 induces cell death enhancement by 5-ALA under thermal stress in U2-OS and WI-38 cells but not in the 5-ALA-sensitive cells.
Notes: U2-OS and WI-38 cells were grown with indicated combinations of 5-ALA and an ABCG2 inhibitor fumitremorgin C (FTC) at 37 (open bars) and 42 °C (closed bars) for 24 h and counted for cell death by trypan blue staining (A) and the cell lysates were subjected to HPLC analysis of intracellular PpIX amount (B). 5-ALA-sensitive cells were grown with indicated combinations of 5-ALA and FTC at 37 and 42 °C for 24 h and counted for cell death by trypan blue staining (C). Bars represent mean ± SEM (n = 3–5). Brackets: *p < 0.05; **p < 0.01.
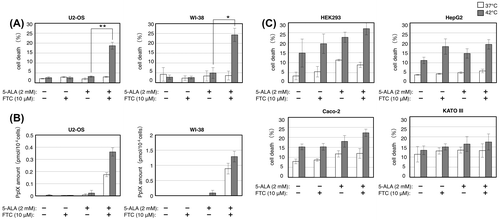
Fig. 6. Effect of 5-ALA on ROS generation under thermal stress.
Notes: Cells were grown with indicated concentrations of 5-ALA and 5 μM 3′-(p-aminophenyl) fluorescein (APF) at 37 and 42 °C for 24 h, and subjected to flow cytometery. x axis shows the fluorescence (relative to that at 37 °C without 5-ALA, whose peak value is adjusted to 200) derived from APF oxidized by intracellular ROS.
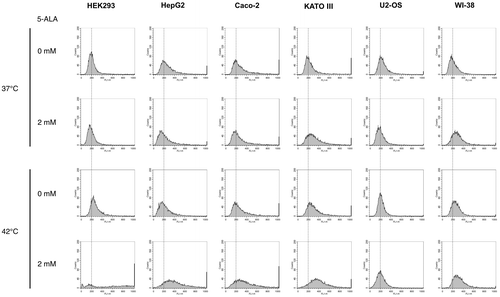
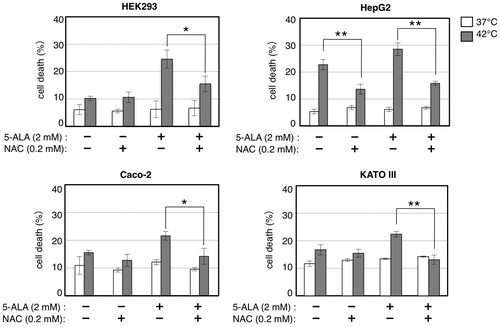
Fig. 7. N-acetylcysteine (NAC) compromises the cell death enhancement by 5-ALA under thermal stress.
Notes: Cells were grown with indicated combinations of 5-ALA and N-acetylcysteine (NAC) at 37 (open bars) and 42 °C (closed bars) for 24 h and counted for cell death by trypan blue staining. Bars represent mean ± SEM (n = 3–5). Brackets: *p < 0.05; **p < 0.01.