1,987
Views
21
CrossRef citations to date
0
Altmetric
Food & Nutrition Science

Anti-obesity effect of Triticum aestivum sprout extract in high-fat-diet-induced obese mice

, , , , , , , & show all
Pages 1133-1140 | Received 19 Aug 2014, Accepted 14 Dec 2014, Published online: 30 Apr 2015

Figures & data

Table 1. Effects of TAEE on body weight gain, food intake, and food efficiency in HFD-induced obese mice.

Table 2. Effects of TAEE on serum lipid profiles in HFD-induced obese mice.

Fig. 1. Effects of TAEE on weight and histological changes in EWAT in HFD-induced obese mice.
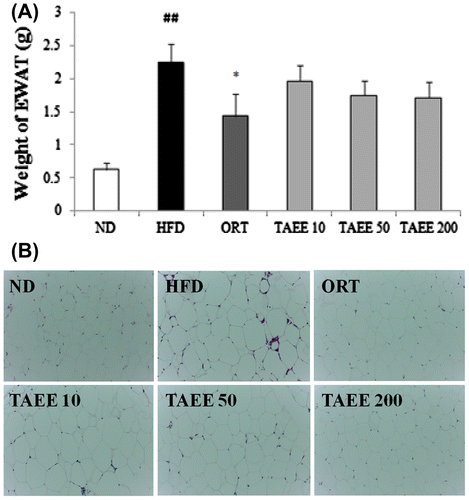
Notes: (A) Weight of EWAT and (B) histology of EWAT. All sections were stained with hematoxylin and eosin (H & E), 200×. Values are expressed as means ± SD. ##p < 0.01 vs. ND, *p < 0.05 vs. HFD.
Fig. 1. Effects of TAEE on weight and histological changes in EWAT in HFD-induced obese mice.

Fig. 2. Effect of TAEE on a weight and histological changes of liver in HFD-induced obese mice.
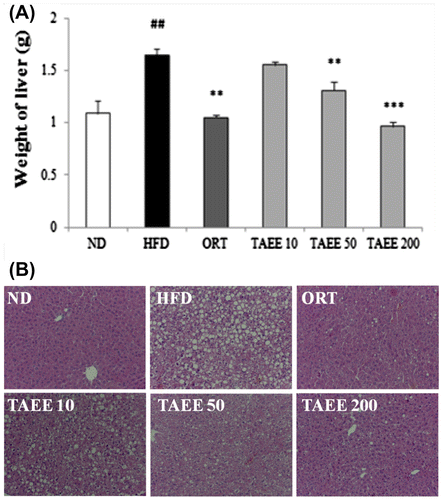
Notes: (A) Weight of liver and (B) histology of liver. All sections were stained with H & E, 200×. Values are expressed as means ± SD. ##p < 0.01 vs. ND, **p < 0.01, ***p < 0.001 vs. HFD.
Fig. 2. Effect of TAEE on a weight and histological changes of liver in HFD-induced obese mice.

Table 3. Effects of TAEE on hepatic lipid contents in HFD-induced obese mice.

Fig. 3. Effect of TAEE on serum leptin and adiponectin concentration in HFD-induced obese mice.
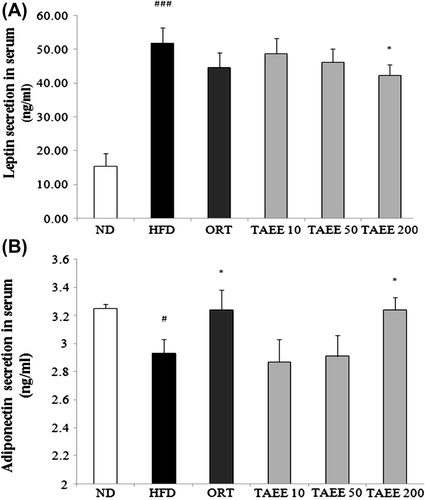
Notes: Levels of leptin (A) and adiponectin (B) were assayed by using ELISA. Values are expressed as means ± SD. #p < 0.01, ###p < 0.01 vs. ND, *p < 0.05 vs. HFD.
Fig. 3. Effect of TAEE on serum leptin and adiponectin concentration in HFD-induced obese mice.

Fig. 4. Effect of TAEE on the expression of PPARγ and FAS in EWAT of HFD-induced obese mice.
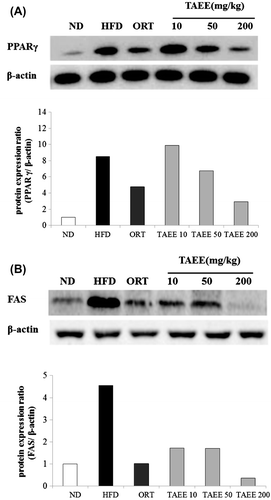
Notes: Protein levels of PPARγ (A) and FAS (B) were determined by Western blot analysis and expressed as percent of ND. Values are expressed as means ± SD.
Fig. 4. Effect of TAEE on the expression of PPARγ and FAS in EWAT of HFD-induced obese mice.
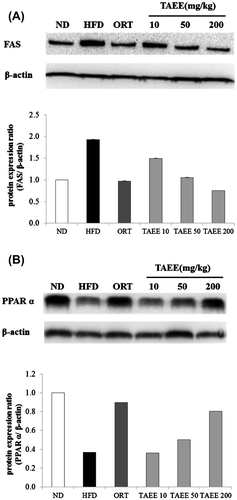
Fig. 5. Effect of TAEE on the expression of FAS and PPARα in liver of HFD-induced obese mice.

Notes: Protein levels of FAS (A) and PPARα (B) were determined by Western blot analysis and expressed as percent of ND. Values are expressed as means ± SD.
Fig. 5. Effect of TAEE on the expression of FAS and PPARα in liver of HFD-induced obese mice.

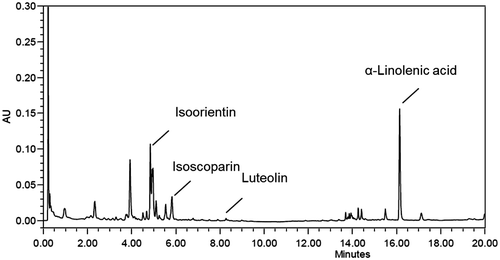
Fig. 6. UPLC profile of TAEE.

Fig. 6. UPLC profile of TAEE.

Reprints and Corporate Permissions

Please note: Selecting permissions does not provide access to the full text of the article, please see our help page How do I view content?

To request a reprint or corporate permissions for this article, please click on the relevant link below:

Academic Permissions

Please note: Selecting permissions does not provide access to the full text of the article, please see our help page How do I view content?

Obtain permissions instantly via Rightslink by clicking on the button below:

If you are unable to obtain permissions via Rightslink, please complete and submit this Permissions form. For more information, please visit our Permissions help page.