Figures & data
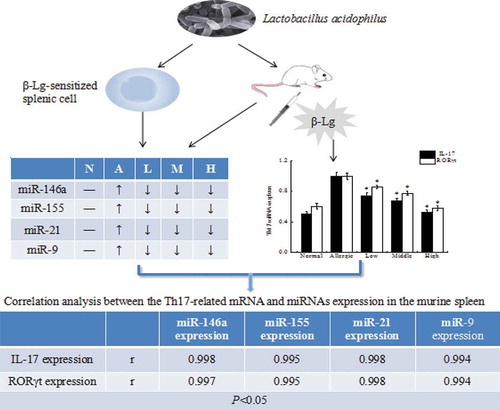
Table 1. Quantitative RT-PCR primers designed for the detection of Th17 cell response.
Table 2. Quantitative RT-PCR primers designed for the detection of miRNAs.
Figure 1. The immunomodulatory properties of live L. acidophilus KLDS 1.0738 in β-Lg-sensitized murine splenocytes.
Female BALB/c mice were intraperitoneally injected on days 7, 14 and 21 with 0.2 mL 1 mg/mL β-Lg adsorbed in Freund’s adjuvant. After final orally β-Lg challenge, splenocytes (5 × 10⁶ cells/ml) were prepared and cultured with 1 mg/mL β-Lg in the absence (A: allergic group) or presence of various concentrations of live L. acidophilus (L: low dose, 107 CFU/mL; M: medium dose, 108 CFU/mL; H: high dose, 109 CFU/mL). The cells cultured with RPMI-1640 medium alone was used as normal control (N). The cells and culture supernatants were collected, and the proliferative response (A), total IgE (B), β-Lg-specific IgE (C), cytokines (D) and the expression of miRNAs (E) were measured. Experiments were repeated 3 times, and the values are the average ± SD. *P < 0.05 versus allergic group by the ANOVA-LSD post hoc test.
Figure 2. Protective effect of live L. acidophilus KLDS 1.0738 strains against β-Lg- -induced allergy in BALB/c mice.
BALB/c mice were sensitized intraperitoneally on days 7, 14 and 21 with 1 mg/mL of β-Lg plus Freund’s adjuvant at a total volume of 0.2 mL (A: allergic group). L. acidophilus bacteria suspension (L: low dose, 107 CFU/mL; M: medium dose, 108 CFU/mL; H: high dose, 109 CFU/mL) was intragastrically given to the β-Lg-challenged mice three times a week from days 1 to 28. Control mice were treated with sterile saline (N). Body weight (A), anaphylactic score (B), colon H&E staining (C), fecal microflora (D), the production of β-Lg-specific IgE (E) and histamine (F) in serum were measured in the mice. All results are representative for 3 independent experiments. Results of experiments are means ± SD (n = 6 mice per group). *P < 0.05 versus allergic group by the ANOVA-LSD post hoc test.
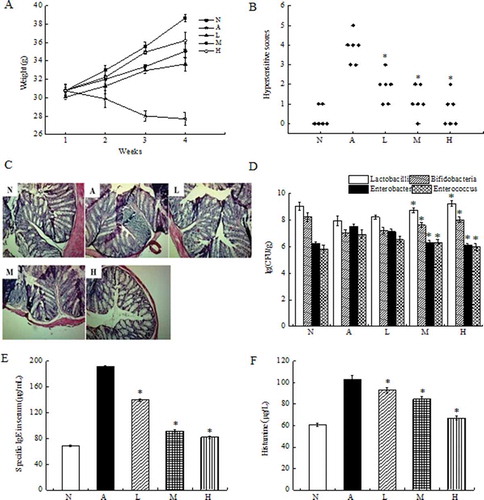
Figure 3. Effect of oral administration of live L. acidophilus KLDS 1.0738 on the expression of miRNAs, IL-17 and RORγt in spleen and colon tissue of β-Lg-sensitized mice.
After antigen challenge, the expression of miRNAs, mRNA expression of IL-17 and RORγt in the colon (A, C) and spleen (B, D) were measured by Real-Time PCR. All results are representative for 3 independent experiments. The results are means ± SD (n = 6 mice per group). *P < 0.05 versus allergic group by the ANOVA-LSD post hoc test. N: Normal group; A: Allergic group; L: Low dose (107 CFU/mL); M: Middle dose (108 CFU/mL); H: High dose L. acidophilus (109 CFU/mL).
Figure 4. The correlation between the Th17-related mRNA and different miRNAs expression in the murine spleen.
The correlation of the gene expressions of IL-17 and miR-146a (A), miR-155 (B), miR-21 (C), miR-9 (D), and the correlation of the gene expressions of RORγt and miR-146a (E), miR-155 (F), miR-21 (G) and miR-9 (H) in the murine spleen of high dose of L. acidophilus group (dots on the left side) compared to allergy group (dots on the right side). A value of P < 0.05 was considered significantly correlation.