
Figures & data
Figure 1. Spatial learning and memory ability were assessed by Morris water maze and step-down avoidance task. (a) The swim tracks of the rats during Morris water-maze testing. (b) Comparison of the latency to find the platform among the four groups in Morris water-maze testing. The 1, 2, 3, 4, and 5 represent the latency day. (c) Percentage of time in the training quadrant. (d) Step-down latency time. Each group consisted of 6 rats. Values represent mean ± SD, ** p < 0.01, *** p < 0.001, vs. Sham group. #p < 0.05, ##p < 0.01, vs. DOX group.
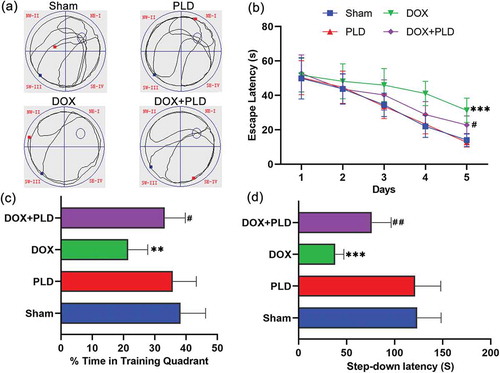
Figure 2. PLD alleviated neurodegeneration induced by DOX. (a) Histological sections of hippocampus were observed by HE staining (magnification, ×200). Black arrows indicated nuclear pyknosis and degeneration in the DOX group. (b) Histological sections of the hippocampus were observed by toluidine blue staining (magnification, ×200). Black arrows indicated the degenerated neurons possessing pyknotic nuclei in the DOX group.
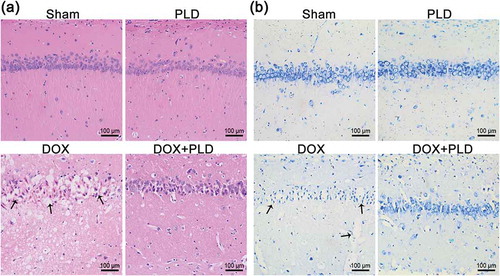
Figure 3. Effects of PLD treatment on DOX-induced oxidative stress and pro-inflammatory response in hippocampal tissues. (a) The content of MDA was expressed as nmol/mgprot. (b) The content of GSH was expressed as μmol/gprot. (c) The content of TNF-α was expressed as pg/mgprot. (d) The content of PGE-2 was expressed as pg/mgprot. (e) The content of COX-2 was expressed as ng/mgprot. Data are presented as mean ± SD (n = 6). **p < 0.01, ***p < 0.001, vs. Sham group. #p < 0.05, ##p < 0.01, ###p < 0.001, vs. DOX group.
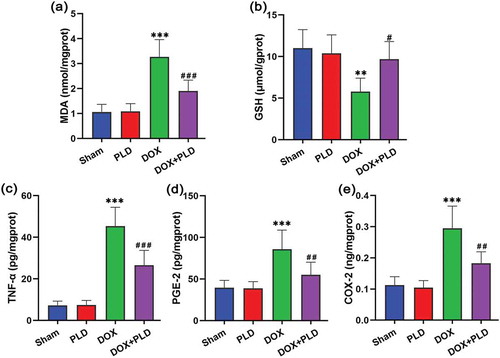
Figure 4. Effect of PLD on DOX-induced neuronal apoptosis in the hippocampus. (a) Immunofluorescence staining for TUNEL (green), DAPI (blue), and merged images. (b and c) The expression of cleaved caspase-3 and cleaved caspase-9 were assessed by Western blot. Data are presented as mean ± SD (n = 6). ***p < 0.001, vs. Sham group. ##p < 0.01, ###p < 0.001, vs. DOX group.
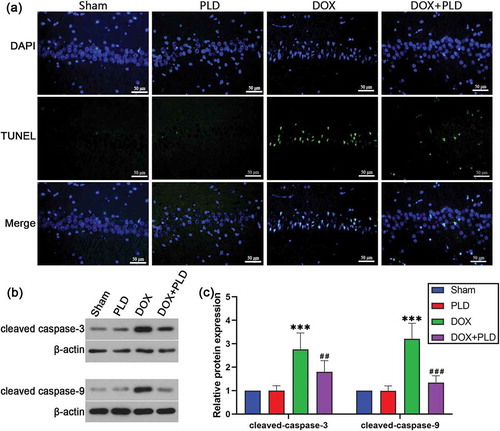
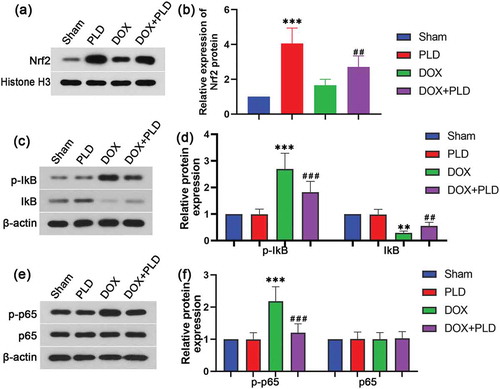
Figure 5. Effect of PLD on the signal pathway in the hippocampus of rats with DOX-induced chemobrain. Protein expression of Nrf2 (a and b), p-IκB (c and d), IκB (c and d), p-p65 (e and f) and p65 (e and f) was evaluated by Western blot. Data are presented as mean ± SD (n = 6). **p < 0.01, ***p < 0.001, vs. Sham group. ##p < 0.01, ###p < 0.001, vs. DOX group.
Data availability statement
The data described in this article are openly available in the Open Science Framework at DOI:10.17605/OSF.IO/TPA6U.